World Intellectual Property Indicators: Filings for Patents, Trademarks, Industrial Designs Reach Record Heights in 2018
October 18, 2019
The growth of patent applications in 2018 continued (ninth year in a row) and was up to 5.2% according to WIPO’s annual World Intellectual Property Indicators (WIPI) report. 3.3 million patent applications were filed worldwide, trademark filing activity rose up to 14.3 million, while that for industrial designs reached 1.3 million.
And the overall increase in demand for the protection of intellectual property (IP) rights was determined by the dynamics of China, the United States of America have maintained their primacy in the number of patent applications (230,085 applications) filed in export markets.
In 2018, more than two-thirds (66.8%) of all global patent applications, trademarks and industrial designs fell on Asia. WIPO Director General Francis Gurry mentioned that “Asia has become a global hub for innovation”.

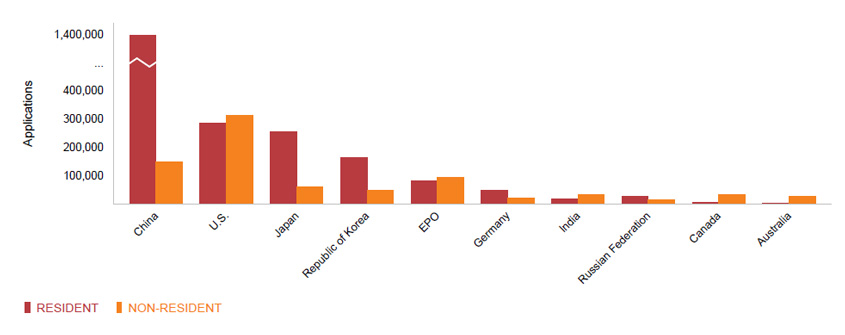
The Russian Federation featured among the top 10 offices of national patent applications (37,957 applications), led by China with a new world record of 1.54 million applications, which is 46.4% of the global total.
- China (1.54 million applications),
- U.S (597 141 applications),
- Japan (313 567 applications),
- Republic of Korea (209,992 applications),
- European Patent Office (174,397 applications),
- Germany (67,898 applications),
- India (50,055 applications),
- Russian Federation (37,957 applications),
- Canada (36,161 applications),
- Australia (29,957 applications).

During the reporting year, patents in force worldwide grew by 6.7% to reach 14 million.
- U.S (3.1 million),
- China (2.4 million),
- Japan (2.1 million).
At the same time, half of all patents in force in the U.S. originate from abroad, while in China domestic applicants accounted for around 70% of all patents in force.
An estimated 10.9 million trademark applications covering 14.3 million classes were filed worldwide in 2018. Offices located in Asia accounted for 70% of all trademark filing activity, Europe’s share was 15.8%.
- China (7.4 million classes),
- U.S (640 181 class),
- Japan (512 156 classes),
- European Union Intellectual Property Office (EUIPO, 392 925 classes),
- Islamic Republic of Iran (384 338 classes).
There were an estimated 49.3 million active trademark registrations worldwide in 2018 – up 13.8%.
1 million industrial design applications were filed worldwide in 2018.
- China (708 799 samples),
- EUIPO (108, 174 sample)
- Republic of Korea (68,054 samples),
- U.S (47 of 137 samples),
- Germany (44 of 460 samples).
At the same time, Russia entered the top-20 IP offices where the number of industrial design applications was increased (+21%). The total number of industrial design registrations in force worldwide grew by 6.5% to reach around 4 million.
According to data received from 92 national and regional authorities, it should be noted that in 2018 there were more than 65 thousand protected geographical indications (GIs).
- Germany (15,566),
- China (7247),
- Hungary (6683),
- Czech Republic (6285).
In addition, plant variety applications grew by 8.9% worldwide.
- China (5760 applications),
- Community Plant Variety Office of the European Union (3554 applications),
- U.S (1609 applications),
- Ukraine (1575 applications),
- Japan (880 applications).
Revenue generated by the trade and the educational sectors of the publishing industry of 14 countries amounted to USD 42.5 billion.
- U.S (USD 23.3 billion),
- Germany (USD 6.1 billion),
- U.K (USD 5.4 billion),
- France (USD 3 billion).