4 Indicators to Measure Gender Gap in Innovation
March 3, 2022

March 2022 ・ 3 minutes reading time
There are several measures of gender gaps in innovation. However, choosing the “right” indicator depends on the purpose. Here are some suggestions on what to consider when choosing the type of indicator.

Once you are familiar with How to Measure the Gender Gap in Innovation, the next challenge is to choose the “right” indicator of gender disparity.
Unfortunately, we do not have access to the perfect indicator. But collecting data on the share of female to male inventors in intellectual property (IP) documents are easily implemented, and despite their inherent limitations, can highlight the state of gender disparity in in innovation, and potentially contribute to a change for the better.
1. The percentage of patent applications made by at least one female inventor
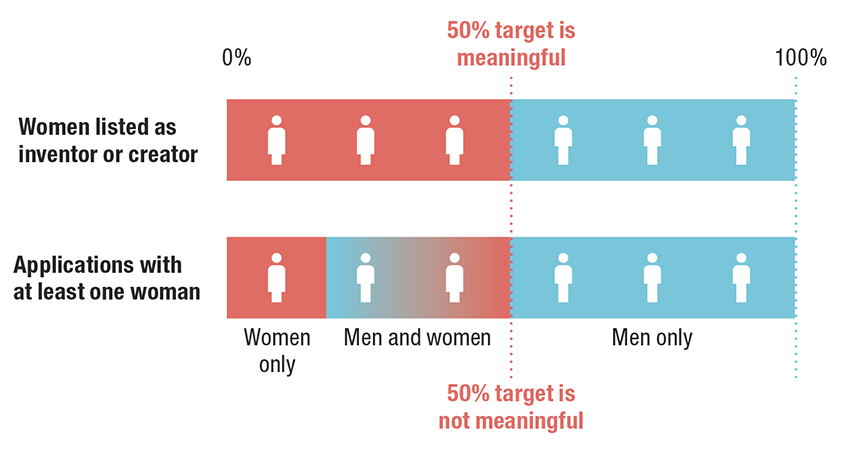
The percentage of applications with at least one female inventor or creator reflects women contribution to patenting. It is a convenient indicator because it uses the same unit as many other IP indicators and thus allows for comparison between them.
The limit of using the percentage of female patent applicants
However, it may lead to an underestimation of gender imbalance and may not be a good starting point to address gender gaps in innovation (see figure below).

2. The percentage of women inventors
An alternative and more intuitive indicator is the percentage of women listed as inventors or creators. This indicator measures women’s use of IP within the organization or country. It may be better suited for gender policies, as it provides a clear target, such as 50 percent of women listed as inventors or creators.
The limits of using the percentage of women inventors
The downside of this indicator is that it is not comparable with other common IP indicators for which the denominator is usually either patent applications or applicants (e.g. the share of non-residents among applicants, or the share of applications by region).
As told in “What do we know about the Gender Gap in Innovation?”, the representation of women is uneven across industries and sectors. Women are better represented in the life sciences and biotech industries, as well as in academia. When addressing potential gender biases in innovation at an organizational-, or industrial-level, the target should be set with an eye toward the average level in the industry or sector to which the organization belongs.
If the relevant perspective is national or country-level, in which case both industries and sectoral views should be included, the aggregated gender gap indicator may hide different compositions and thus not be sufficiently informative.
Example of the limits of using the percentage of women inventors
Suppose two countries, A and B, with two sectors, academia and industry. Both countries report an overall proportion of 12% women inventors so that based on this measure, one could rank the two countries equally. Yet academia accounts for only 20% of all inventors in country A, compared to 50% in country B. Taking this into account, country A actually does better than country B in academia (50% vs 20%), but worse in industry (2.5% versus 4%). It becomes clear that the indicators must be compared within each sector and industry. For this purpose, sectors are observed through patent applicants, while industries can be deduced from the patent technology classes.
3. Likelihood of women being sole inventor and patent applicant
Finally, other indicators are available to explore the nature of collaboration between men and women in innovation, and the intensity of women participation into IP activities by country, region or city. For example, women are more collaborative than men, as they file more often with other inventors than by themselves as reported in the research paper "Identifying the gender of PCT inventors".
4. Gender diversity in teams
Further exploration can be done by examining the average team size when all inventors are women, or men, or a majority of women, or a majority of men, or else a fair balance of men and women.
Similarly, one can explore different women inventor rates across countries, regions or cities.
For more information on this topic, you can consult WIPO’s Guidelines for producing gender analysis and our selection of publications from our Economics Literature Database.
Related resources
Guidelines for producing gender analysis from innovation and IP data
Understanding how women and men can access and use the intellectual property (IP) system equally is key to ensuring that their ingenuity and creativity translates into economic, social and cultural development. This short guide summarizes best practice for producing innovation and IP gender indicators.