Boosting economic growth through industry diversification
June 29, 2023
- Japan, Switzerland, Germany, the Republic of Korea, and Singapore top the ranking of countries with most diverse and complex products exported.
- The Philippines, China, and the Republic of Korea achieved the greatest improvements in the rankings during the decade leading up to 2020.
- Among the developing economies with less complex economic structures, Cambodia, Ethiopia, Kazakhstan, Kyrgyzstan, Laos, Myanmar, Tajikistan, and Viet Nam made remarkable advancements.
- China, Viet Nam, Uganda, Indonesia, and India standout as frontrunners projected to experience rapid economic growth until 2030 thanks to their ability to diversify into industries that are more complex.
The journey towards economic development hinges upon the acquisition and utilization of productive knowledge, particularly in increasingly sophisticated – aka complex – industries and products. To chart a course toward robust economic growth, economies must effectively diversify into products that require rich and deep know-how which only a few other countries master, including innovation-intensive sectors such as information and communication technologies (ICTs), pharma, medical technologies, and different high-tech engineering products.
Embracing this premise, the Economic Complexity Index (ECI) of Harvard University, an indicator used in the Global Innovation Index (GII) 2023, evaluates economies' competitive standing in terms of the advanced nature and diversification of their exports.
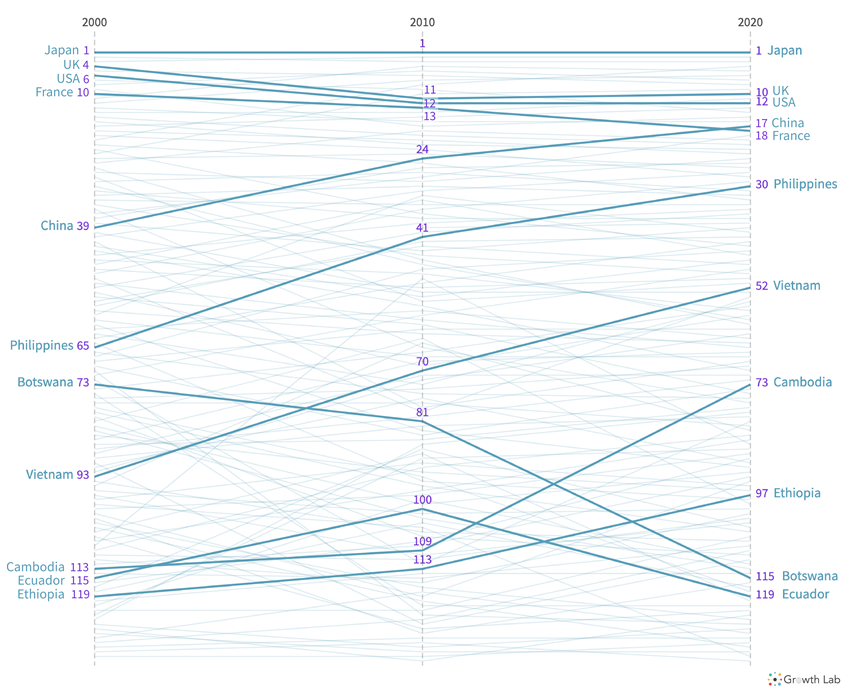
Based on this, Japan, Switzerland, Germany, the Republic of Korea, and Singapore top the rankings (see Figure 1). The Czech Republic, Austria, Sweden, Hungary and the UK (see Table 1) follow. The US ranks 12th.
Figure 1. Economic Complexity Index Ranking: 2000-2020, Selected Countries

Table 1. Top 10 in the Economic Complexity Index 2020.
Rank |
Economy Name |
1 |
Japan |
2 |
Switzerland |
3 |
Germany |
4 |
Republic of Korea |
5 |
Singapore |
6 |
Czech Republic |
7 |
Austria |
8 |
Sweden |
9 |
Hungary |
10 |
United Kingdom |
When it comes to regional leadership in Latin America, the countries at the forefront are Mexico, Panama and Costa Rica. The regional leaders in Northern Africa and Western Asia are Israel, Türkiye and Saudi Arabia. Table 2 provides an overview of all other regional leaders.
Table 2. Top 3 by region, 2020
Region |
Economy Name |
Regional rank |
Overall Economic Complexity Rank |
South East Asia, East Asia and Oceania |
Japan |
1 |
1 |
Republic of Korea |
2 |
4 |
|
Singapore |
3 |
5 |
|
Europe |
Switzerland |
1 |
2 |
Germany |
2 |
3 |
|
Czech Republic |
3 |
6 |
|
Northern America |
United States of America |
1 |
12 |
Canada |
2 |
43 |
|
Latin America and the Caribbean |
Mexico |
1 |
20 |
Panama |
2 |
40 |
|
Costa Rica |
3 |
48 |
|
Northern Africa and Western Asia |
Israel |
1 |
21 |
Türkiye |
2 |
41 |
|
Saudi Arabia |
3 |
42 |
|
Central and Southern Asia |
India |
1 |
46 |
Kyrgyzstan |
2 |
54 |
|
Sri Lanka |
3 |
71 |
|
Sub-Saharan Africa |
Mauritius |
1 |
65 |
South Africa |
2 |
69 |
|
Uganda |
3 |
86 |
The Philippines, China, and the Republic of Korea have made the greatest improvements in the rankings among economies with complex sectors (see Figure 1).
Among developing countries characterized by less complex economies, notable progress has been achieved by Cambodia, Ethiopia, Kazakhstan, Kyrgyzstan, Laos, Myanmar, Tajikistan and Viet Nam.
Thanks to their ability to diversify into more complex sectors, over the last two decades (2000-2020), China, Viet Nam, Uganda, Indonesia, and India are projected to be among the fastest-growing economies to 2030.
The next WIPO World IP Report 2024 is scheduled to discuss the matter of economic complexity in detail. Stay tuned!
Background
The Global Innovation Index rankings incorporate economic complexity as indicator number 6.3.2 within the Knowledge diffusion subpillar, which is part of the Knowledge and technology outputs pillar. The Economic Complexity Index (ECI) captures the diversity and sophistication of a country's productive capabilities through its exports. These data are obtained from the Atlas of Economic Complexity, which features data visualizations covering 250 countries and territories, classified into 20 categories of goods and 5 categories of services, and, combined, 6,000 products worldwide. The raw trade data on goods are derived from countries’ reporting to the United Nations Statistical Division (COMTRADE). The trade data on services are from the International Monetary Fund (IMF) Direction of Trade Statistics database, via the World Development Indicators. Source: The Atlas of Economic Complexity, Harvard’s Growth Lab’s, Harvard Kennedy School of Government, https://atlas.cid.harvard.edu/about-data.