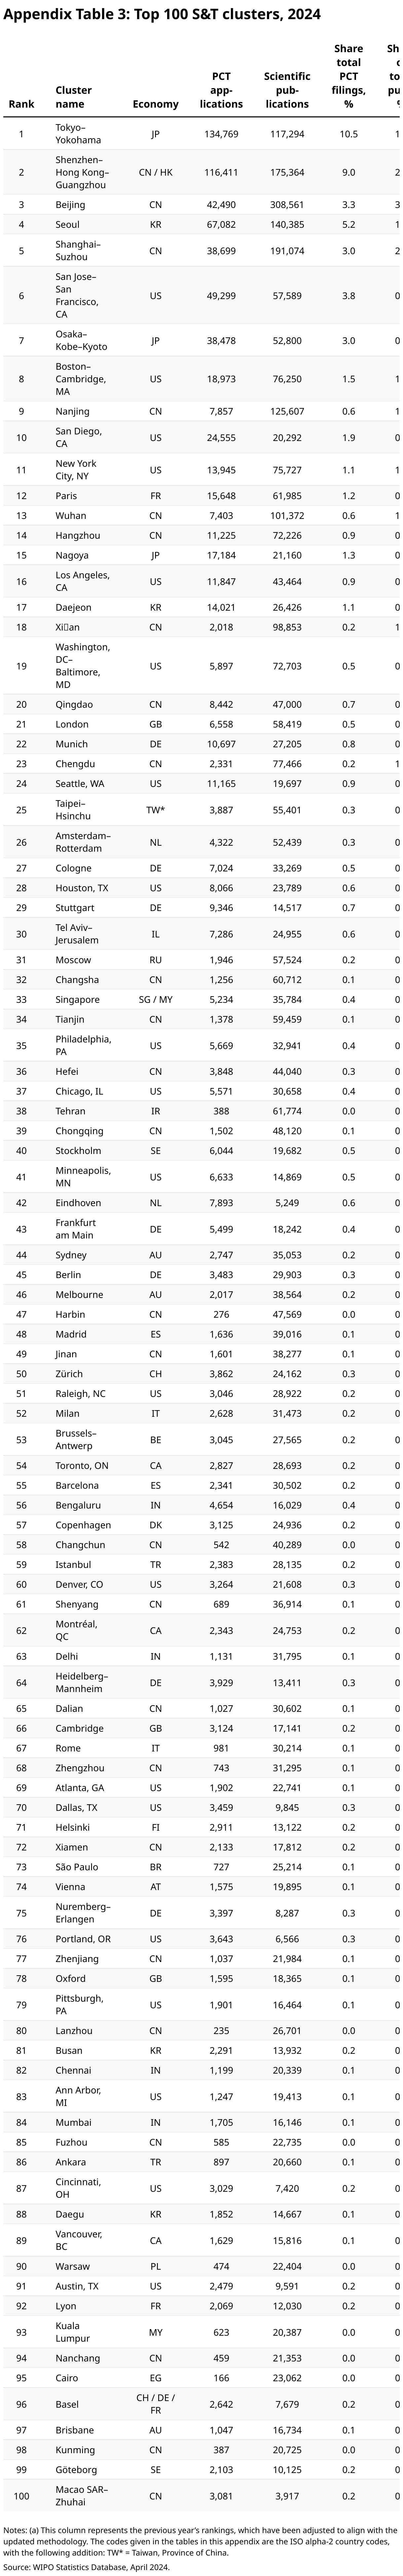
Since 2016, the Global Innovation Index (GII) has sought to identify science and technology (S&T) clusters using a bottom-up approach. This approach disregards administrative or political borders and instead pinpoints those geographical areas that show a high density of inventors and scientific authors. The resulting clusters often encompass several municipal districts, sub-federal states and sometimes even two or more countries. Two innovation metrics are employed in the compilation of the top 100 GII S&T clusters worldwide: location of inventors listed on published patent applications and authors listed on published scientific articles.
For patents, this method relies on applications under WIPO’s Patent Cooperation Treaty (PCT). PCT patents offer a useful basis for analyzing patents globally. The PCT system applies a single set of procedural rules and collects information based on uniform filing standards. This reduces potential biases that could arise from using data collected from multiple national sources. The patents selected were published over the most recent five-year period available, between 2019 and 2023, to minimize the effects of volatility that can occur between years.
To widen the range of innovation included, scientific publications from the Web of Science’s Science Citation Index Expanded (SCIE) are incorporated. The SCIE provides detailed coverage of the world’s most impactful academic journals. For the analysis presented here, science and technology fields are the focus, while articles from the fields of social sciences and humanities are disregarded. In addition, scientific publications are limited solely to articles of original research. This excludes other published items, such as meeting abstracts, conference summaries or paper briefs. As with PCT filings, the most recent five-year period according to data availability was also used for the SCIE – publication years 2018 to 2022.
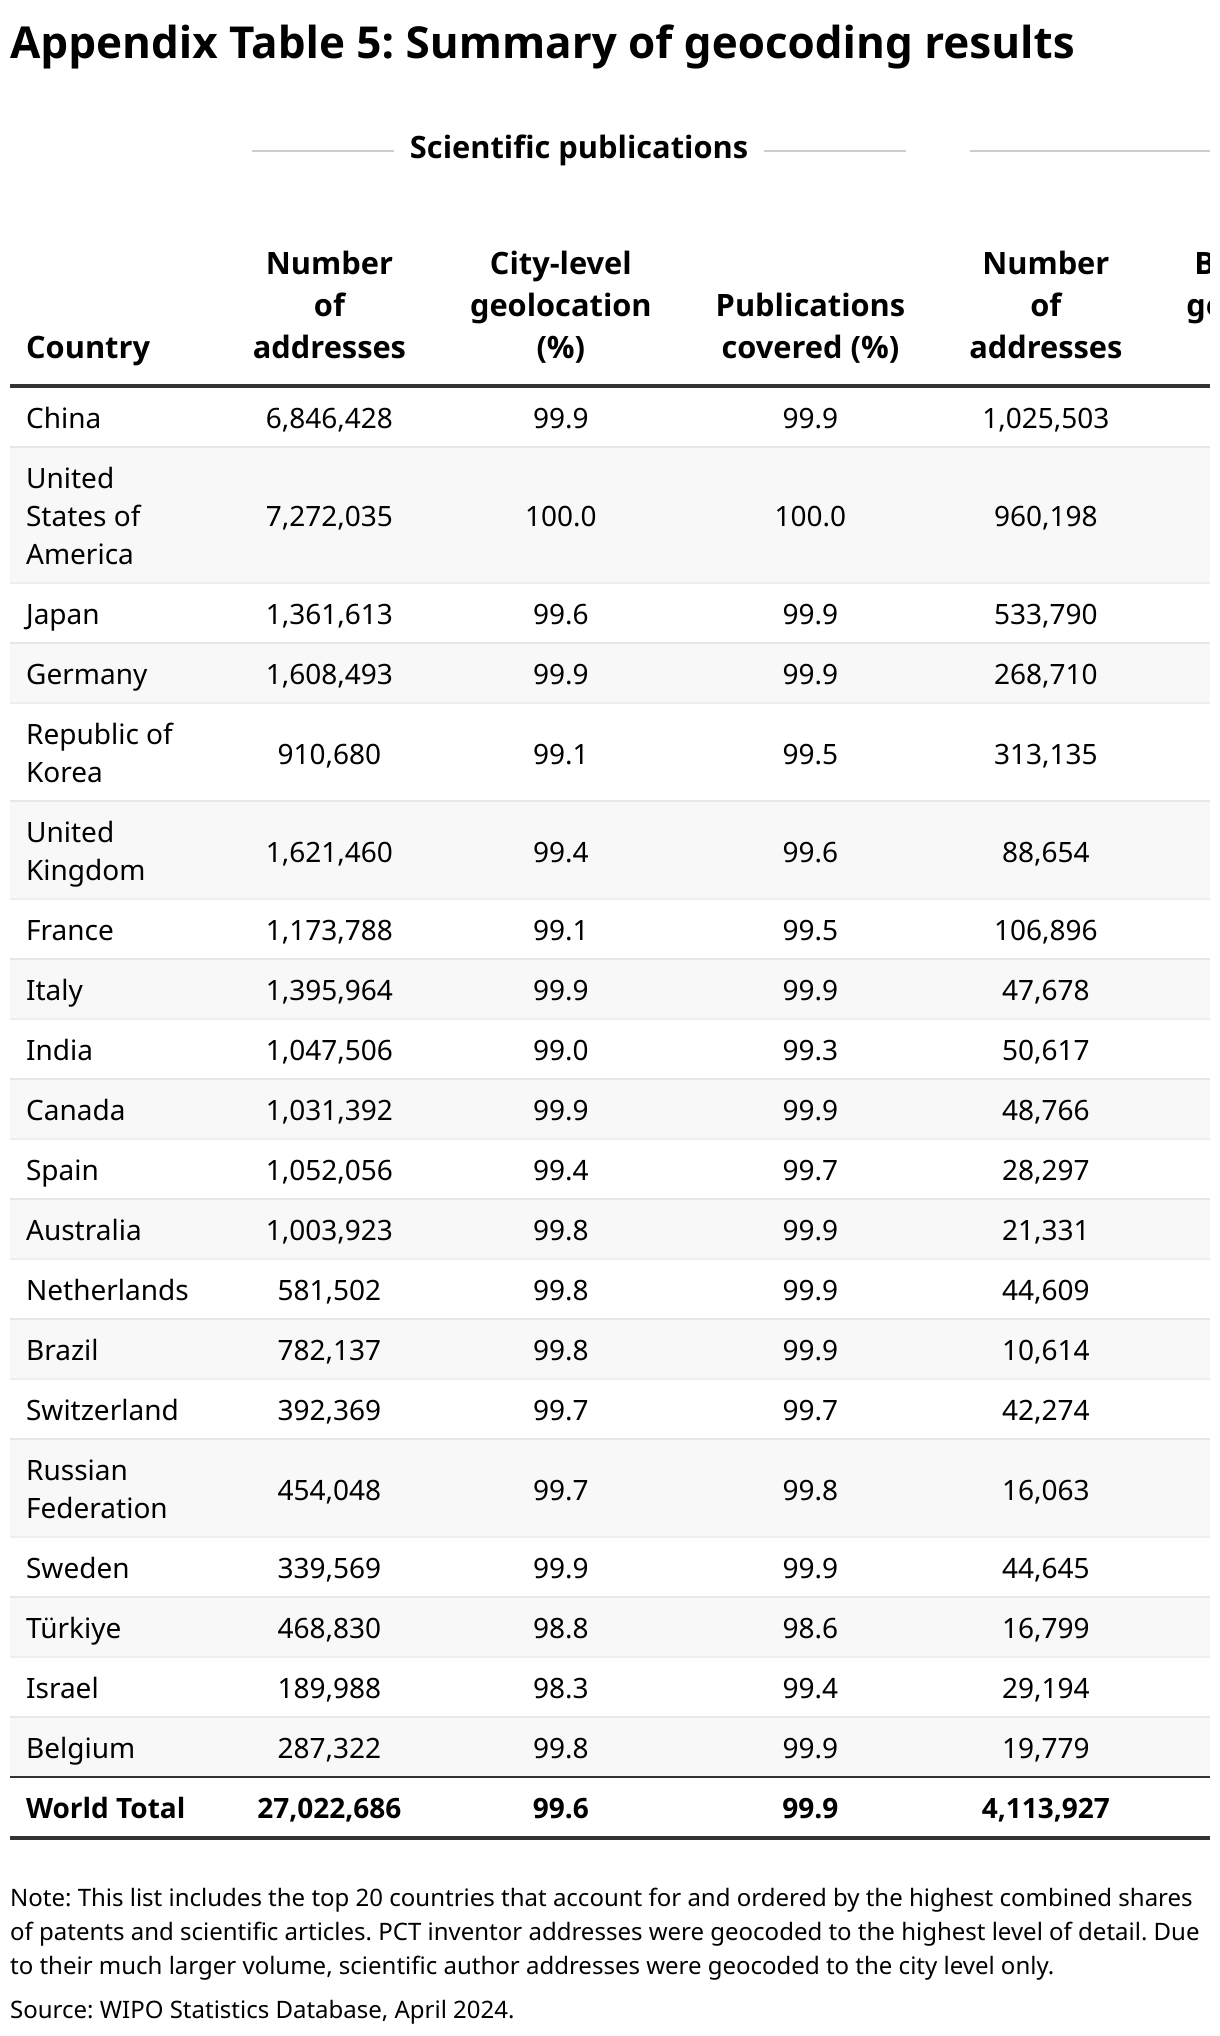
The WIPO PCT patent data set consists of approximately 1.3 million patent applications published between 2019 and 2023, containing 4.1 million inventor addresses. For the SCIE, the data set comprises 7.9 million articles published between 2018 and 2022, containing 27 million listed author addresses.
The process for geocoding of addresses for this report is as follows. PCT inventor addresses were geocoded using the Environmental Systems Research Institute (ESRI) ArcGIS World Geocoder service.
Overall, 98 percent of inventor addresses were geocoded at either the city level or a more accurate level, while 99.6 percent of scientific author addresses were geocoded at the city level. Appendix Table 10 provides a summary of the geocoding results for the top 20 countries, which together account for the majority of inventor and scientific author addresses. As shown in the table, the coverage of geocoded PCT inventor addresses across all 20 countries is above 99 percent. Similarly, coverage of scientific author addresses is also high, above 99% in all but one instance. This marks an improvement in geocoding coverage as compared to previous years. Two reasons account for this. First there was noticeable improvement in ESRI’s World Geocoder service, especially in Japan and Republic of Korea. Second, we made a stronger effort to match addresses that were previously not matched to any geocode through increased utilization of ESRI’s geocoder and manual geocoding.
Addresses were clustered by applying the density-based spatial clustering of applications with noise (DBSCAN) algorithm. This algorithm requires predefined radius and density parameters. As in previous years, a radius of 15 km and a density of 4,500 listed inventors/authors was applied. Equal weight was given to inventors and authors by expressing data points as a share of total inventor and author addresses, respectively. Given that the number of scientific articles far exceeds the number of patents, cluster identification based on the raw data points would have resulted in clusters shaped predominantly by the scientific author landscape.
The result was an initial list of 242 clusters. After review, neighboring clusters were merged if the edge of one cluster was within 3–5 km of another and where the co-author/co-inventor relationships were higher than for any other relationship with any other cluster or non-cluster points. A total of 20 clusters met these criteria, with mergers reducing the overall number of clusters identified to 232.
The remaining 232 clusters were then ranked by counting the number of patents and scientific articles in a given cluster. Numbers were aggregated using fractional counting, in which counts reflect the share of a patent’s inventors and an article’s authors present in a particular cluster. In addition, mirroring the equal weighting approach described above, fractional counts are relative to the total numbers of patents and scientific articles.
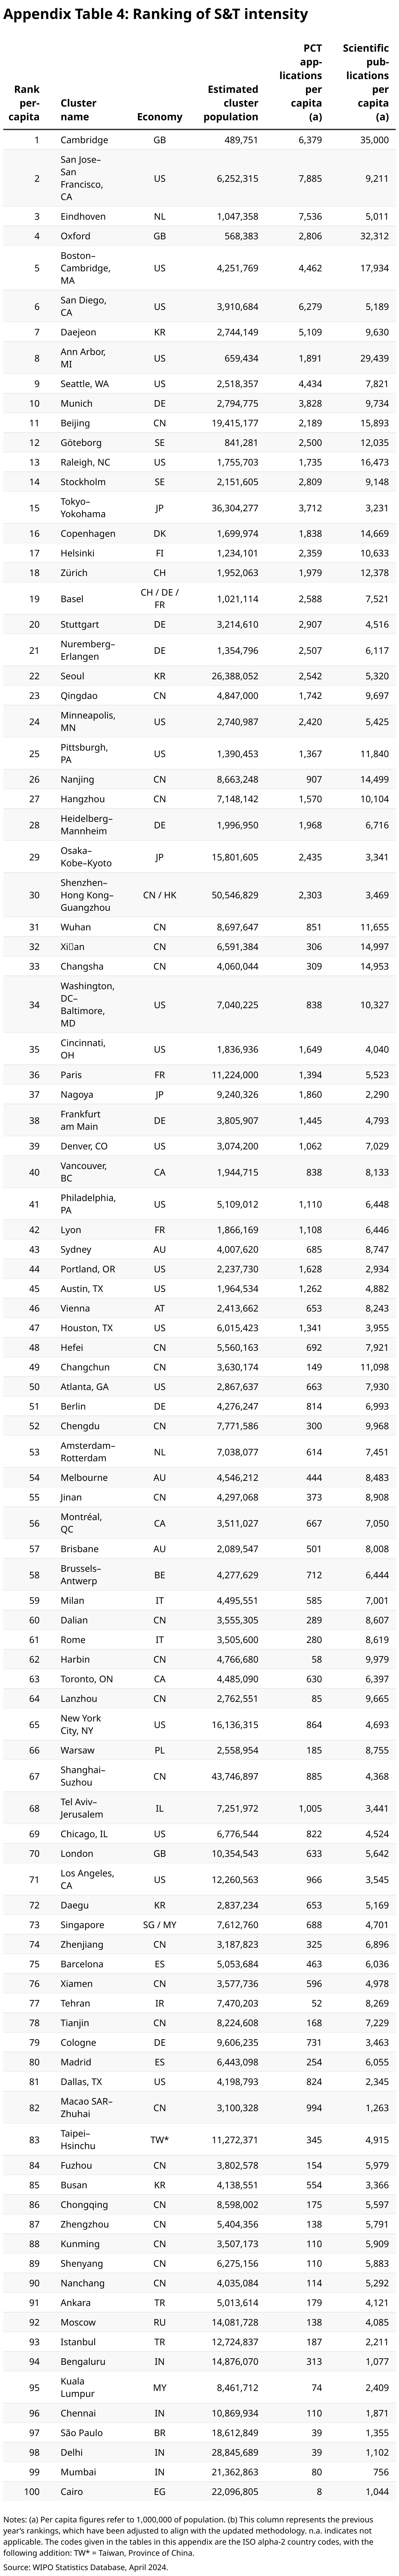
To produce an intensity ranking, the European Commission’s Global Human Settlement Layer (GHSL) population distribution data were matched geographically to the top 100 clusters identified in the overall ranking
Due to the increase in geocoding accuracy and coverage, it was necessary to rerun the clustering process for last year’s S&T clusters. The above steps were repeated for PCT publication years 2018–2022 and SCIE publication years 2017–2021 to form the 2023 clusters and their corresponding rankings anew. These updated rankings are the basis for the “Rank Change” indicators referred to in the section.
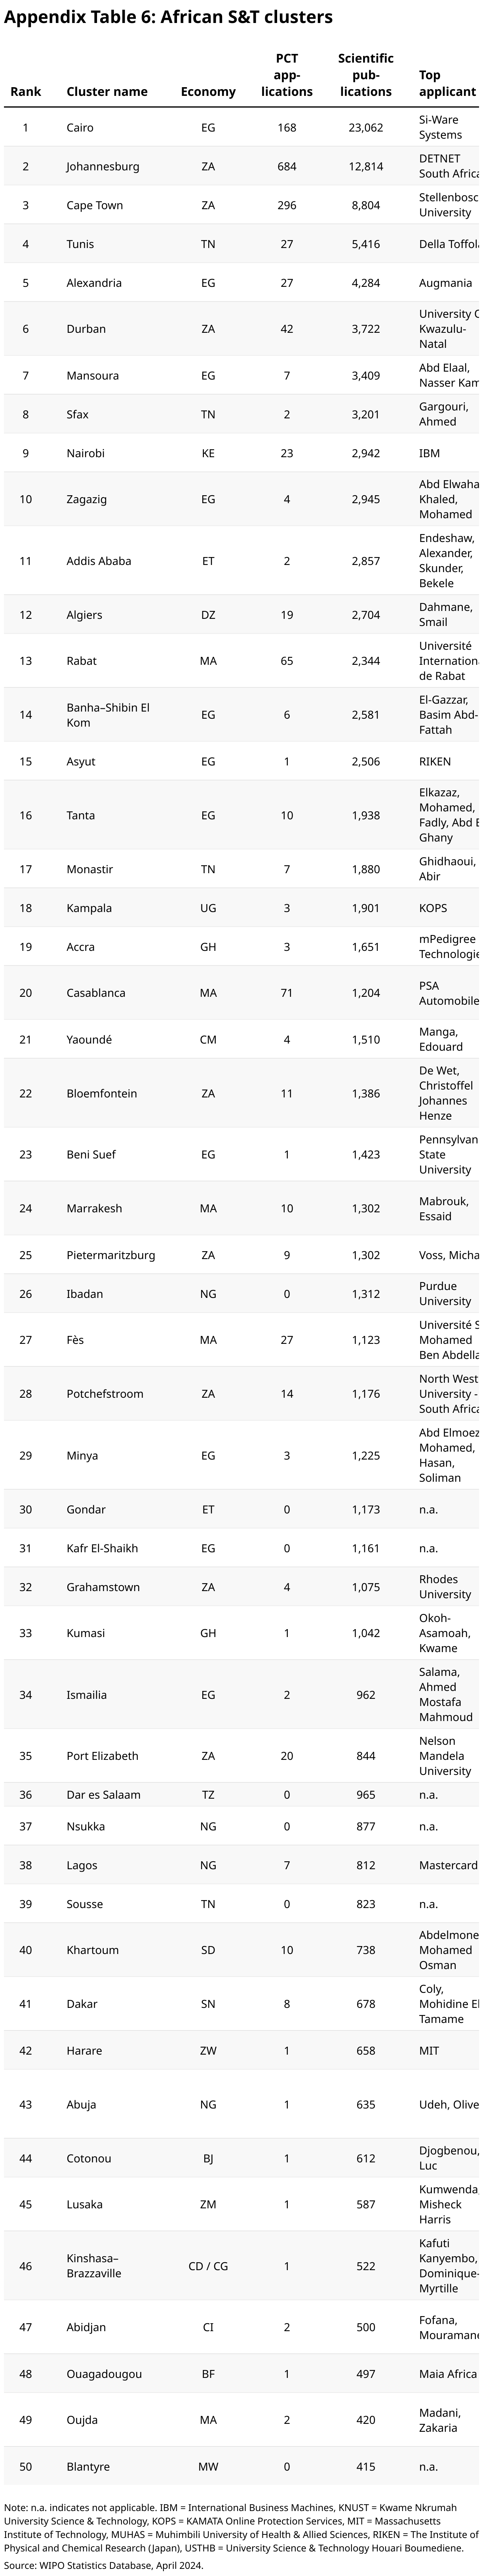
The African clusters were created using a process similar to that used for the overall clusters. Inventor addresses and author affiliations were filtered to include only those within the African continent. We selected the parameters for DBSCAN through multiple iterations, adjusting distance and density values to minimize the number of points clustered that are at extreme distances and maximize the number of points clustered that were close to each other. This process resulted in a distance parameter of 15 km and a density parameter of 300 creating a total of 50 clusters. The African clusters went through the same review process as the overall clusters, where clusters near each other were checked if they met the merging criteria. No clusters were merged
The same distance parameter of 15 km as in the overall clustering was preferred as to both maintain consistency and because many data points are geocoded only at the city level, so a relatively large radius is necessary to accommodate this level of geocoding accuracy. The lower density parameter of 300 for the African clusters, compared to 4,500 for the overall clusters, reflects the expected patent filing and publication rate from the African continent compared to other regions.