The GII 2024 top 100 science and technology clusters
The Global Innovation Index (GII) ranks the world's leading economies according to their innovation capabilities. A common thread among top-performing nations is the presence of thriving science and technology (S&T) clusters. Since 2016, the GII has employed a bottom-up approach to identifying such clusters. This methodology disregards administrative or political borders and instead pinpoints those geographical areas with a high density of inventors and scientific authors. The resulting clusters identified in this way often span several municipal districts, sub-federal states, and sometimes even two or more countries.
Two innovation metrics are used to compile the top 100 GII S&T clusters worldwide (see methodological Appendix IV for details). The first metric focuses on the location of inventors listed in published patent applications under the WIPO Patent Cooperation Treat (PCT).
S&T clusters – which can be entire regions or cities – serve as the backbone of a robust national innovation ecosystem. Situated in areas such as San Francisco's Silicon Valley, Cambridge, Munich and Paris in Europe, or Bengaluru, Seoul, Shenzhen and Tokyo in Asia, these S&T clusters are home to renowned universities, brilliant scientists, R&D-intensive companies, and prolific inventors. It is the collaboration among these entities that results in the groundbreaking scientific advancements and inventions that propel national, regional and global innovation forward.
The GII recognizes the significance of these regional hubs and charts annually the world's top 100 S&T clusters (Map 1). These areas boast the highest density of inventors and scientific authors globally.
The GII 2024 also presents S&T clusters beyond the top 100 in order to shed light on other areas around the world with an appreciably high level of science and technology. In addition, the GII 2024 takes a first step toward highlighting S&T clusters within Africa, a region whose output is typically not taken account of when clustering at the global level.
Lastly, to complement this section of the GII, a series of “Top Clusters Briefs” provide further details on top ranking hotspots. This complements other work undertaken by WIPO to better measure and understand sub-national innovation activity (
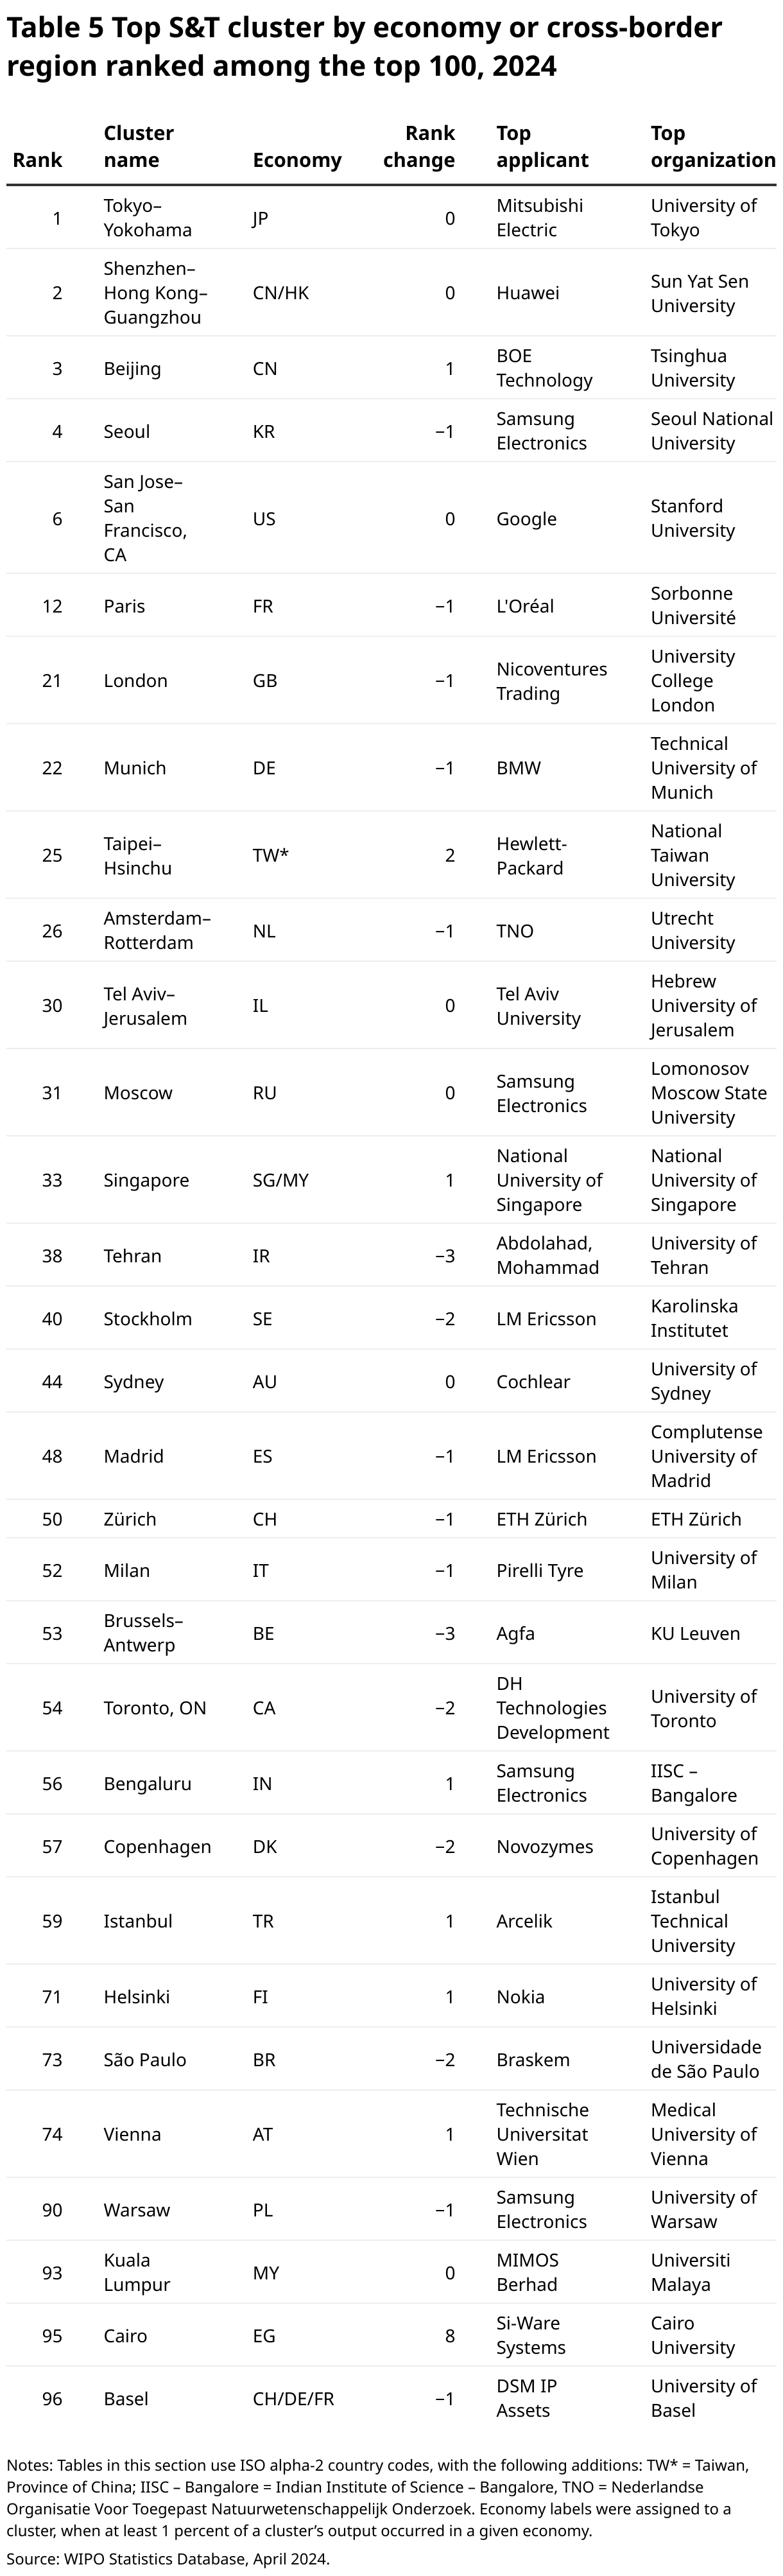
Tokyo–Yokohama plus six other Asian and three US clusters lead the top 100 S&T clusters
Among the top 100 S&T clusters, Tokyo–Yokohama (Japan) is the top performing cluster, followed by Shenzhen–Hong Kong–Guangzhou (China and Hong Kong, China). Both clusters rank one and two owing to having a large output of PCT applications, thanks in great part to patents filed by Mitsubishi Electric located in Tokyo–Yokohama and Huawei located in Shenzhen–Hong Kong–Guangzhou, respectively. When combined, Tokyo–Yokohama and Shenzhen–Hong Kong–Guangzhou account for almost one in every five PCT applications filed globally.
Beijing (China), Seoul (Republic of Korea) and Shanghai–Suzhou (China) follow, ranking 3rd, 4th and 5th, respectively. Beijing (China) reclaims third spot in the rankings, overtaking Seoul (Republic of Korea) in fourth, in 2024. Shanghai–Suzhou (China) is in the top 5, primarily owing to a strong growth in PCT filings. San Jose–San Francisco, CA (United States of America (US)) follows in 6th position.
 Note: Noise refers to all inventor/author locations not classified as being within a cluster.
The four remaining top 10 clusters are unchanged from the previous year, with the exception of Nanjing (China), replacing San Diego, CA (United States), which is 10th and New York City, NY, which is now 11th. Nanjing’s growth was spurred by its scientific article output, primarily from authors affiliated with Southeast University and Nanjing University.
This year five clusters entered the top 100 for the first time. Nanchang (China) located in the eastern part of Jiangxi Province secures the 94th position. Cairo (Egypt) enters the top 100 ranked 95th. This marks the first time that a Northern African cluster is represented within the top 100 S&T clusters. Following closely behind Cairo’s entrance are two Chinese clusters entering the top 100 for the first time: Kunming, the capital of Yunan Province China (98th), and Macao Special Administrative Region of China–Zhuhai (Macao SAR–Zhuhai) (100th).
For Nanchang (Nanchang University), Cairo (Cairo University) and Kunming (Kunming University of Science and Technology), their total output was primarily in the form of scientific articles, which experienced strong growth in all three clusters and is the reason for their entry into the top 100. Macao SAR–Zhuhai’s primary output is PCT patents, thanks in large measure to the presence of GREE Electric Appliances, which accounts for almost half of Macao SAR–Zhuhai’s applications. Similarly to the other three newcomers to the top 100, the driver behind Macao SAR–Zhuhai’s increased standing in the ranking is a growth in published scientific articles.
Kuala Lumpur (Malaysia) ranked 93rd also appears in the top 100 S&T clusters for the first time. Kuala Lumpur achieved this status thanks to improved geocoding accuracy assigning more author and inventor locations to that city.
Clusters within China once again demonstrated significant increases in S&T output in 2024. China hosts the two fastest growing clusters globally – Hefei (+22.7 percent) and Zhengzhou (+18.9 percent).
Clusters located in other middle-income economies besides China also experienced strong S&T output growth. Cairo (Egypt) had the highest growth rate for this group at 10.9 percent. Chennai (India) with 7.8 percent and Istanbul (Türkiye) with 7.5 percent also had a high rate of growth for this group.
High-income economy clusters generally grew at a slower pace than clusters in middle-income economies, with 37 out of the 63 high-income clusters witnessing negative net S&T output for the period. Nevertheless, notable exceptions to this trend exist among high-income economy clusters. Daejeon (Republic of Korea, +6.9 percent), Seoul (+4.1 percent) and San Diego, CA (+4.2 percent) once again had strong growth years. Warsaw (+3.1 percent) in Poland also experienced strong growth.
The top S&T clusters for each economy or cross-border region are shown in Table 5. The leading clusters per country remain unchanged from last year, except for Sydney overtaking Melbourne to become the leading Australian S&T cluster, with the University of Sydney publishing the most scientific articles and Cochlear, the medical device company, filing the most patent applications. It is notable that Samsung Electronics (Republic of Korea) is also the leading patentee in Bengaluru, Moscow and Warsaw (beyond Seoul).
China and the United States have the most S&T clusters in the top 100 S&T
In 2024, as in previous years, the top 100 S&T clusters continue to be predominantly located in three regions: North America, Europe, and Asia, with a particular concentration in two key economies: China and the United States (see Map 1).
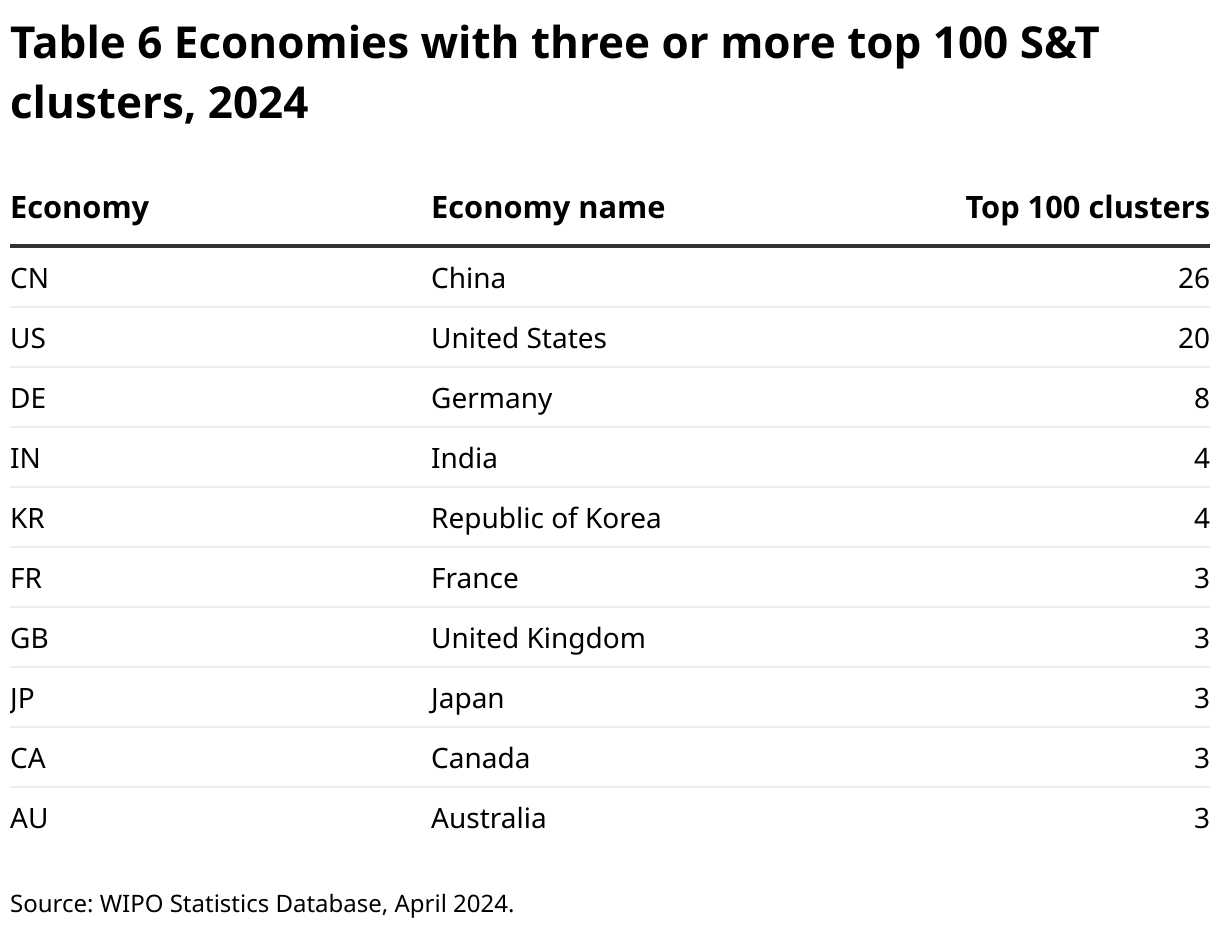
China, for the second consecutive year, leads with the most clusters (26) in the top 100 (Map 2). The United States follows closely behind with 20 clusters. Germany ranks third with eight clusters in the top 100, with Munich (22nd), Cologne (27th) and Stuttgart (29th) its top three clusters. India, with its top cluster of Bengaluru (56th) in southern India, and the Republic of Korea both have four clusters in the top 100. France, the United Kingdom (UK), Japan and Canada each have three clusters in the top 100. Paris (12th) leads France's ranking, while London (21st) represents the United Kingdom's top cluster. Canada's top cluster is Toronto, Ontario (54th).
In addition to China, seven other middle-income economies have clusters among the top 100. They are:
Brazil (1 cluster), with São Paulo, the sole top 100 S&T cluster within Latin America;
Egypt (1), with Cairo, the sole top 100 S&T cluster within Africa (see Map 2);
India (4), with Bengaluru, Delhi, Chennai and Mumbai;
Islamic Republic of Iran (1), with Tehran;
Malaysia (2), with Kuala Lumpur and its cross-border clusters shared with Singapore (see Map 2);
Russian Federation (1), with Moscow; and
Türkiye (2), with Istanbul and Ankara.Türkiye (2), with Istanbul and Ankara.


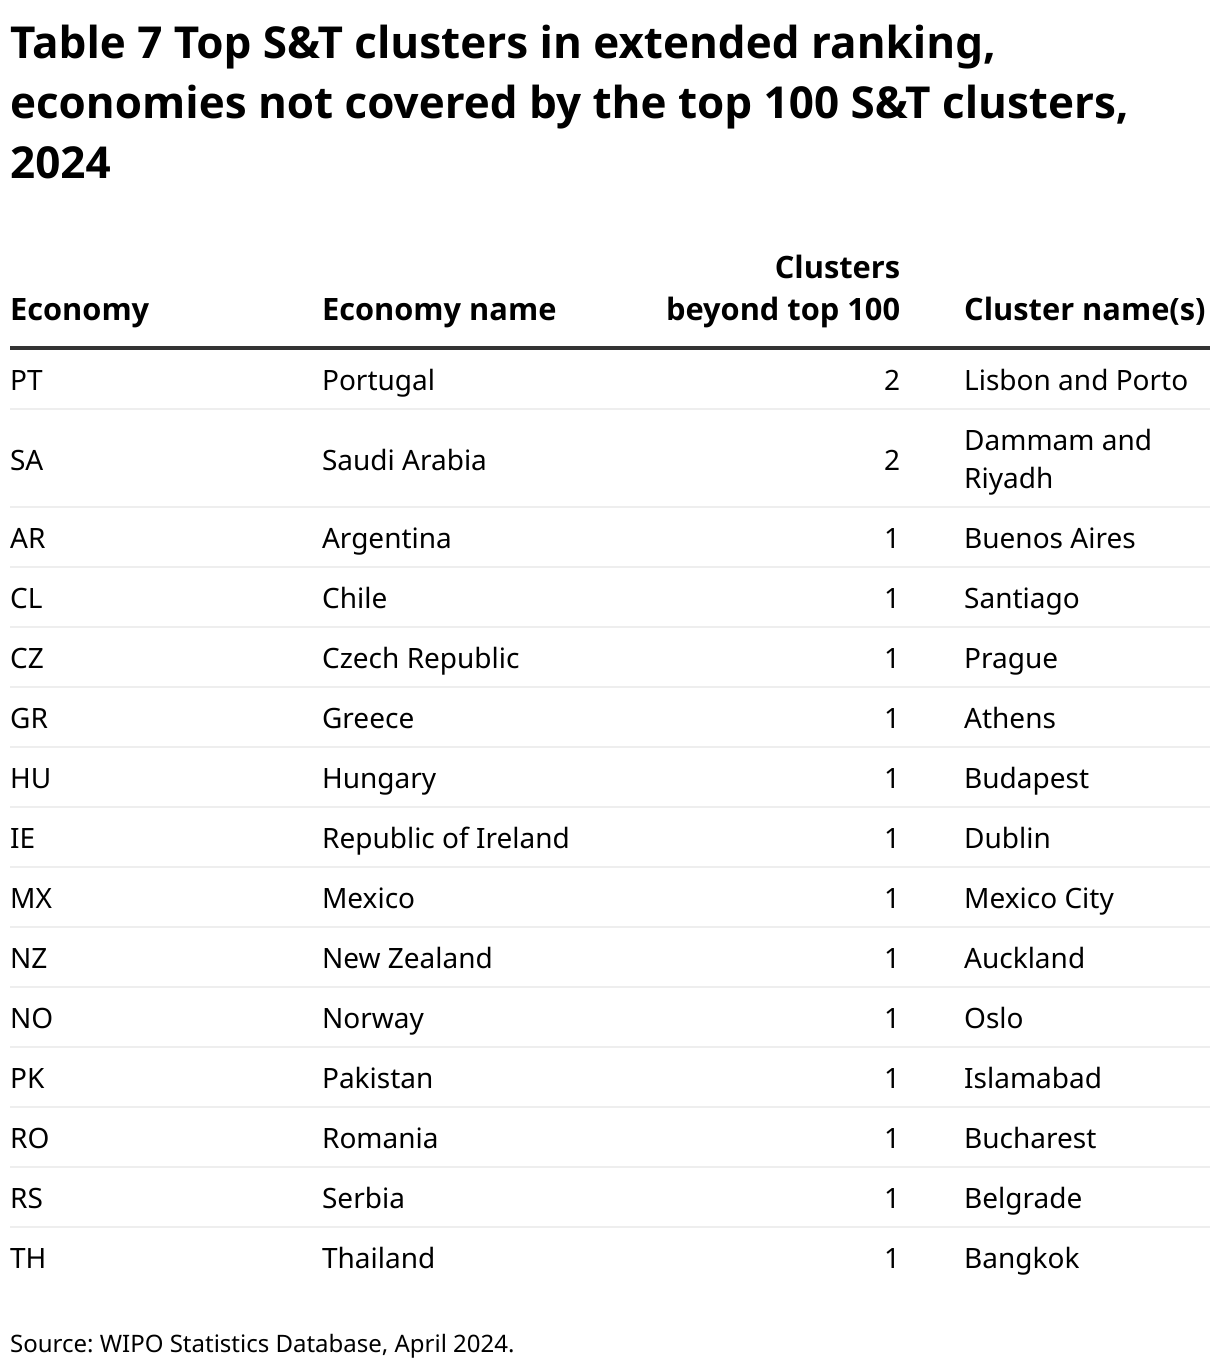
Beyond the top 100, Bangkok, Buenos Aires, Cairo, Kuala Lumpur and Mexico City are top middle-income economy S&T clusters
Based on the same parameters applied to produce the top 100 ranking S&T clusters globally, an additional 132 clusters were identified beyond the top 100, including 24 clusters based in the United States, 15 in China and 11 in each of France and Germany.
Table 7 identifies top S&T clusters in economies not previously represented in the top 100, including Portugal and Saudi Arabia, which each had two clusters.
Middle-income economies Argentina, Mexico, Pakistan, Serbia and Thailand all host a top S&T cluster in the extended list, namely, Buenos Aires, Mexico City, Islamabad, Belgrade and Bangkok, respectively.
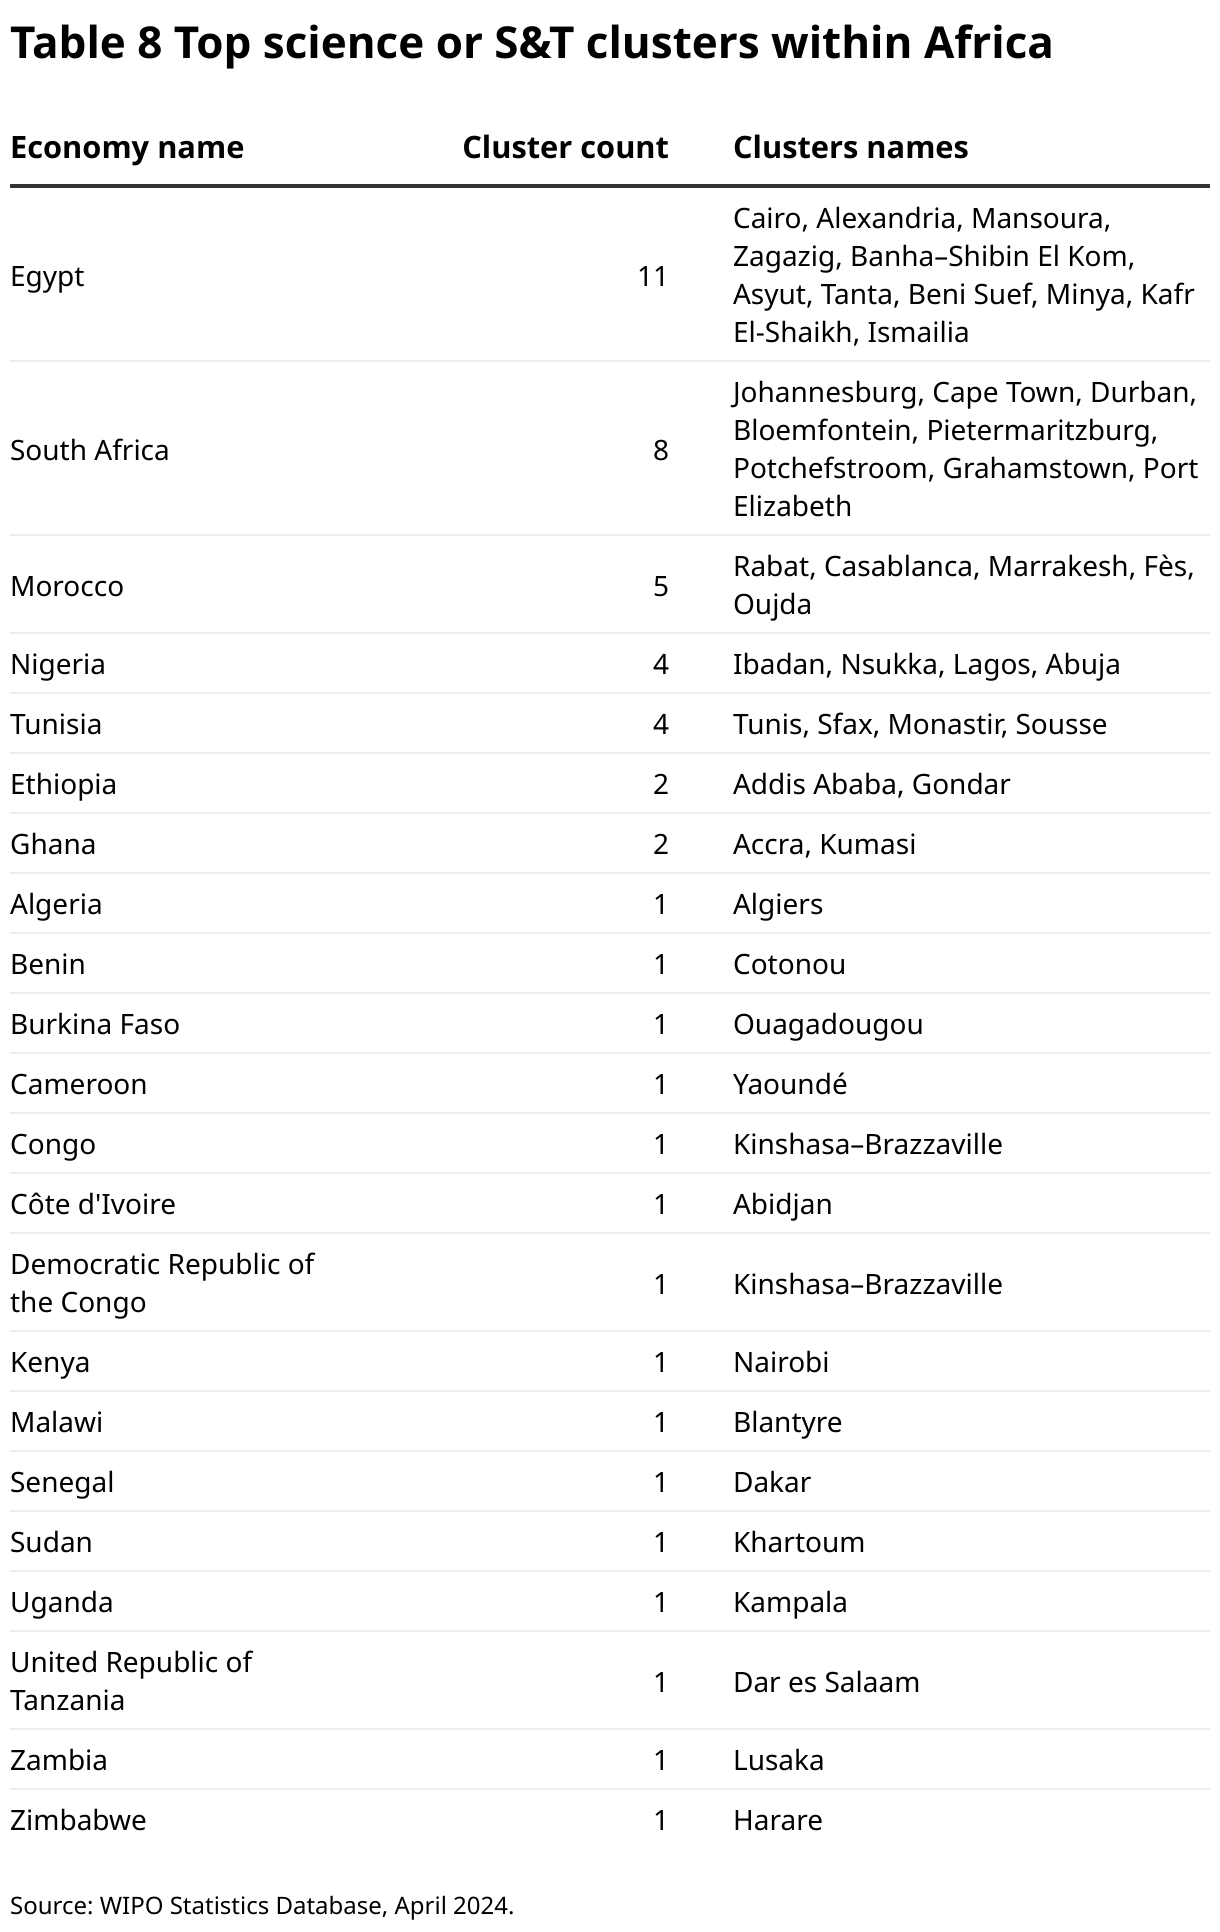
Top science or S&T clusters in Africa
The GII 2024 has sought to identify the top S&T clusters within Africa that would not otherwise have been captured by the GII methodology determining the global 100 top S&T clusters.
To begin, a similar clustering methodology used at the global level was applied to authors and inventors located within the region of Africa. By lowering the density parameter sufficiently (see Appendix IV for more details), the top 50 African clusters were identified (Map 3 and Table 7 for the results).
In addition to Cairo, which has already been highlighted as a GII S&T top 100 ranking cluster, Johannesburg (South Africa), Cape Town (South Africa), Tunis (Tunisia) and Alexandria (Egypt) comprise the top 5 S&T clusters within Africa.
Egypt has the most clusters (11, with Cairo leading), followed by South Africa (8, with Johannesburg leading), Morocco (5, with Rabat leading), Nigeria (4, with Ibadan leading), Tunisia (4, Tunis leading), Ethiopia (2, with Addis Ababa leading), Ghana (2, with Accra leading), Kenya (1, with Nairobi leading), followed by Algeria, Benin, Burkina Faso, Cameroon, the Congo, Côte d'Ivoire, the Democratic Republic of the Congo, Malawi, Senegal, Sudan, Uganda, the United Republic of Tanzania, Zambia and Zimbabwe with each one cluster. Appendix Table 6 shows the top patentees and publishing organizations for said clusters, with the majority of top institutions active in medical technology, and civil engineering, for example.
It is noteworthy, that many, but not all, African clusters are primarily driven by scientific articles and not PCT patenting activity. Hence in certain cases it is more appropriate to label them as African top science clusters, rather than African S&T clusters. That said, it would be wrong to assume that African S&T clusters do not patent at all. Firstly, the clusters in Egypt, South Africa, Morocco, and Tunisia, but also Algeria and Kenya, show significant international patent filing activity. Secondly, it is useful to recall that the GII methodology to determine top S&T clusters only captures patents filed under the PCT System. PCT patents tend to be patents that seek protection in more than one jurisdiction, and therefore does not include the more numerous set of patents that only seek protection in a single jurisdiction, usually the applicants domestic jurisdiction (national patents). While some clusters have modest PCT filing activity as of yet, these same clusters often still show healthy domestic patenting activity. Future editions of the GII will unpack some such clusters in greater detail, including for other world regions in addition to Africa.

S&T intensity of the top 100 clusters: Europe and the United States occupy the top 5 spots, with Cambridge (United Kingdom) and San Jose–San Francisco, CA (United States) out in the lead
Since 2020, the GII has also presented the top 100 clusters ranked by S&T intensity. This ranking is based on the sum of patent and scientific publication shares divided by population. This work draws on geospatial imagery in order to estimate the underlying population level (see Appendix IV).
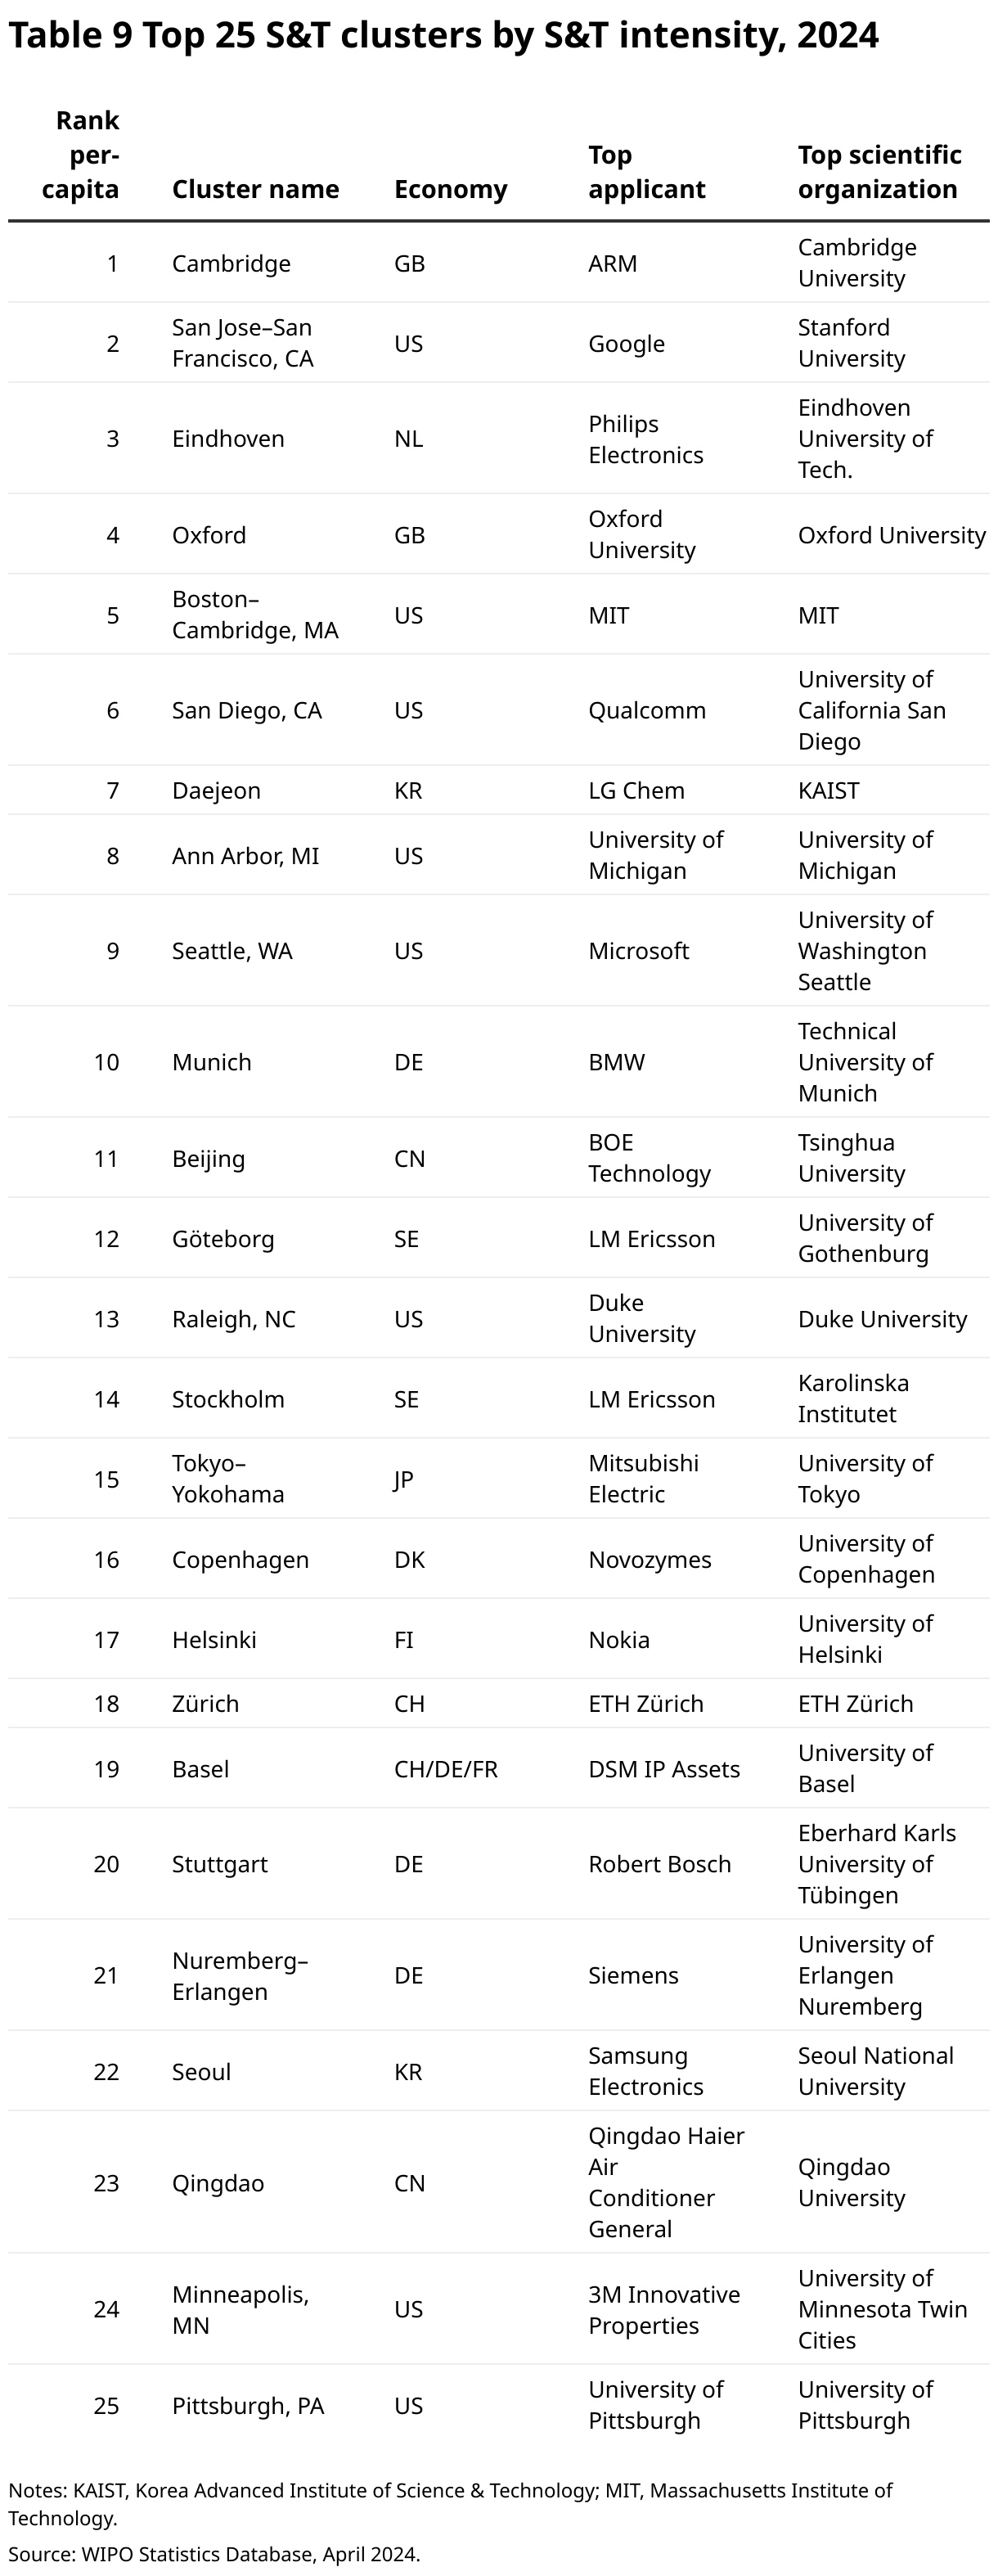
Cambridge in the United Kingdom and San Jose–San Francisco, CA, in the United States were the two most S&T-intensive clusters, globally, followed by Eindhoven (Kingdom of the Netherlands), Oxford (United Kingdom), and Boston–Cambridge, MA (United States) (Table 9).
Cambridge’s position as the top cluster by S&T-intensiveness was once again thanks to the presence of Cambridge University and central processing unit (CPU) maker ARM. Cambridge produced the most articles per capita, at just over 35,000 per one million people (see Appendix Table 4). San Jose–San Francisco, CA, leads on PCT filings per capita, producing roughly 7,900 per one million people, followed by Eindhoven, with 7,536 per million.
There are three clusters among both the global top 10 and the top 10 for intensity, all in the United States: San Jose–San Francisco, CA; Boston–Cambridge, MA, and San Diego, CA.
Daejeon (Republic of Korea) is the highest-ranking Asian S&T cluster by intensity
When viewed with a focus on intensity, many clusters within Europe and North America display a higher level of S&T activity compared to their Asian counterparts. Twelve of the top 25 clusters by intensity are located within Europe. North America had eight clusters in the top 25 by intensity and Asia had five clusters, which is markedly different than the 15 clusters in the global top 25 that were located in Asia (Map 4 and Table 9). Asia’s top cluster by intensity was Daejeon (Republic of Korea) ranked 7th, owing to the presence of LG Chem and LG Energy Solutions. Daejeon was followed by the much larger metropolises of Beijing (China) ranked 11th (up from 14th last year), and Tokyo–Yokohama ranked 15th (up from 17th last year). A new entrant to the top 25 for China was Qingdao, with Qingdao Haier Air Conditioner being the top patentee and Qingdao University the top publishing organization.

