Global patenting activity
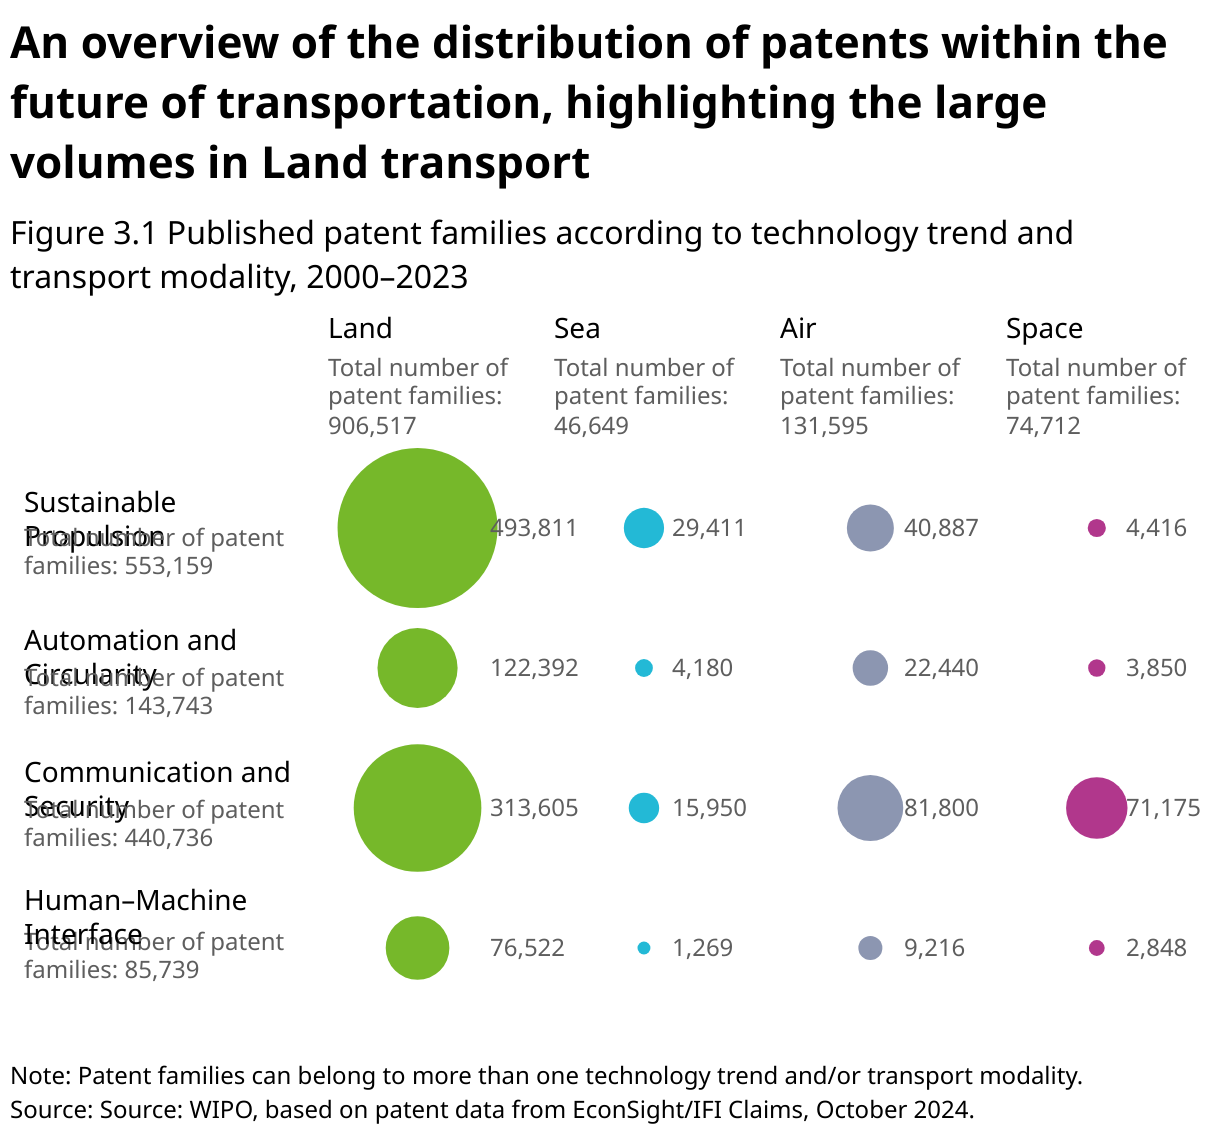
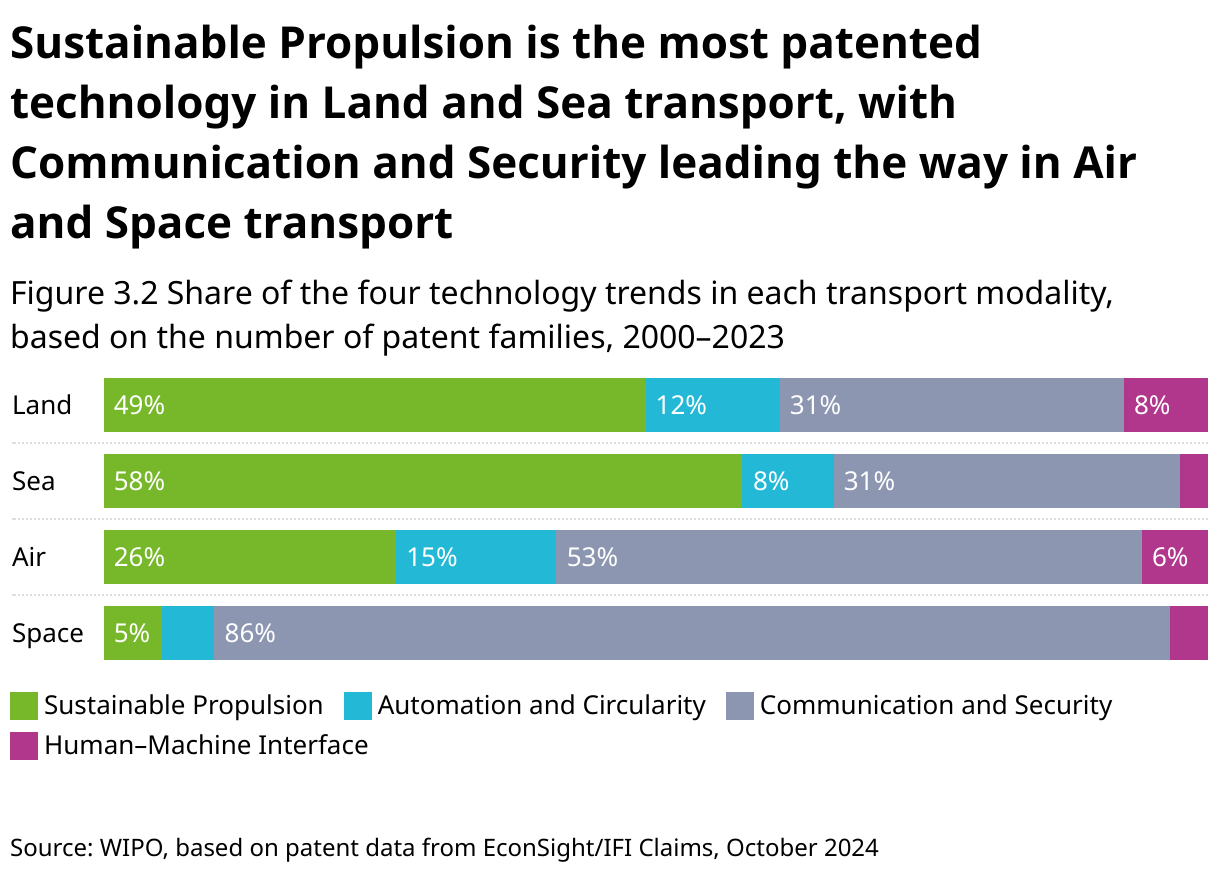
This chapter provides an overview of the development of published patent families in the four different technology trends across the four principal transport modalities (See Figures 3.1 and 3.2). The main findings are as follows:
In terms of research activity, Land transport is by far the largest modality in the field of transportation. This is evidenced by the significant number of patent families in future transport technologies in this area. Since the year 2000, there have been more than 906,000 patent families in the field of Land transport. This figure represents approximately 82% of all identified patents relating to future transport technologies.
In the domain of Land transport, Sustainable Propulsion represents the most significant research area, with more than 553,000 patent families between 2000 and 2023, followed by Communication and Security technologies, with over 440,000 patent families.
Air transport constitutes the second largest mode of transport in terms of research activity, with approximately 132,000 patent families published between 2000 and 2023. Communication and Security represents the leading technology trend within Air transportation.
Patenting activity in Space and Sea transport is considerably lower, with approximately 75,000 and 47,000 patent families, respectively. The primary research areas within Sea transport are Sustainable Propulsion and Communication and Security. In the context of the Space modality, the overwhelming majority of patent families can be attributed to Communication and Security technologies.
It is notable that research activities in Automation and Circularity technologies are of particular significance within the domains of Air and Land transport. In the domain of Air transport, this technology trend accounts for over 14% of all patent families. In the context of Land transport, the respective share exceeds 12%.
In comparison to the other technology trends, research activities in HMI technologies remain relatively limited in the Sea and Space modalities. However, HMI technologies are assuming an increasingly significant role in Air and Land transport, with a share of 6% and 8%, respectively, of all patent families in these modalities relating to HMI technologies.
Patent growth and development
Global patenting activity in future transport technologies has increased significantly over the past few years. A closer examination of the development of the key technology trends in each transport modality reveals that this increase in patenting activity was primarily driven by the dynamic development of Sustainable Propulsion and Communication and Security technologies in the Land transport modality (Figure 3.3). Other significant research areas in terms of the absolute number of patent families include Automation and Circularity, as well as HMI technologies, in Land transport, and Communication and Security technologies in both Air and Space transport.
Patent publications for Land, Sea and Space transport have undergone a growth trend, but those for Air transport reached a preliminary peak in 2021 and have since declined. The challenges faced by the aviation industry in recent years, in particular those due to the effects of the COVID-19 pandemic, are likely to have contributed to the recent slowdown in patenting activity.
An analysis of patent growth rates in recent years (2018–2023) shows that patent families have increased in most technology trends and in each modality since 2018 (Figure 3.4). Communication and Security technologies in Space transportation and Automation and Circularity technologies in Land transportation have experienced the highest growth rate, each recording an compound annual growth rate of published patent families of 13.1% since 2018.
In contrast, patenting activity in HMI technologies has decreased in most transport modalities in recent years, with Land transport being the only exception. In addition, patent growth in Air transport technologies was also only moderate, as only Communication and Security technologies in Air transport showed positive growth rates during the same period.
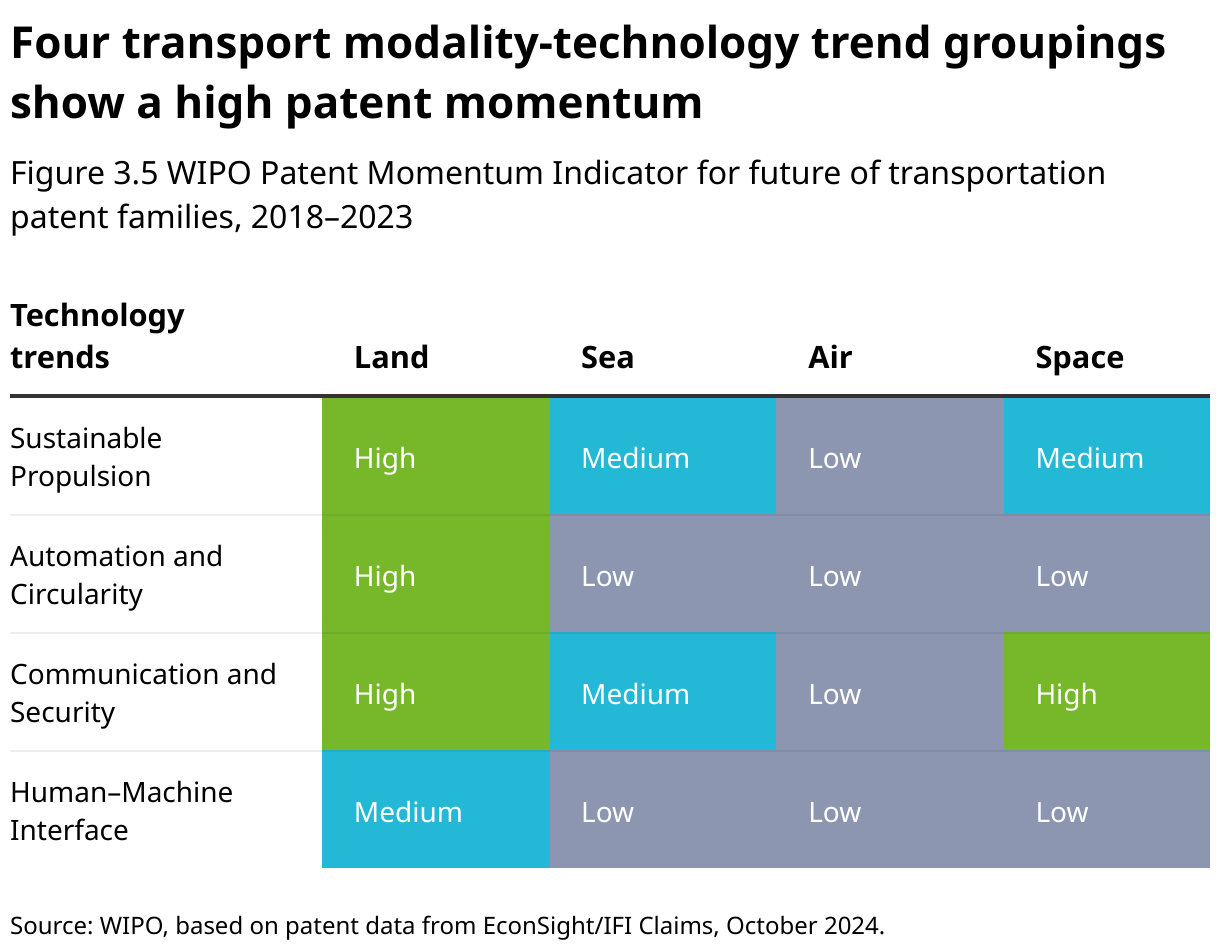
However, focusing on growth rates only serves to ignore the differing levels of patenting activity between different future transport technologies. To address this, the new WIPO Patent Momentum Indicator (see Appendix A.2 for more detail) calculates a score for each of the 16 transport modality-technology trend groupings that reflects both the level of patenting activity and growth dynamics in recent years, in order to identify those technologies having the greatest impact on innovation right now (Figure 3.5). The WIPO Patent Momentum Indicator shows Sustainable Propulsion and Automation and Circularity in Land transport, and Communication and Security technologies in both Land and Space transport as having the highest patent momentum.
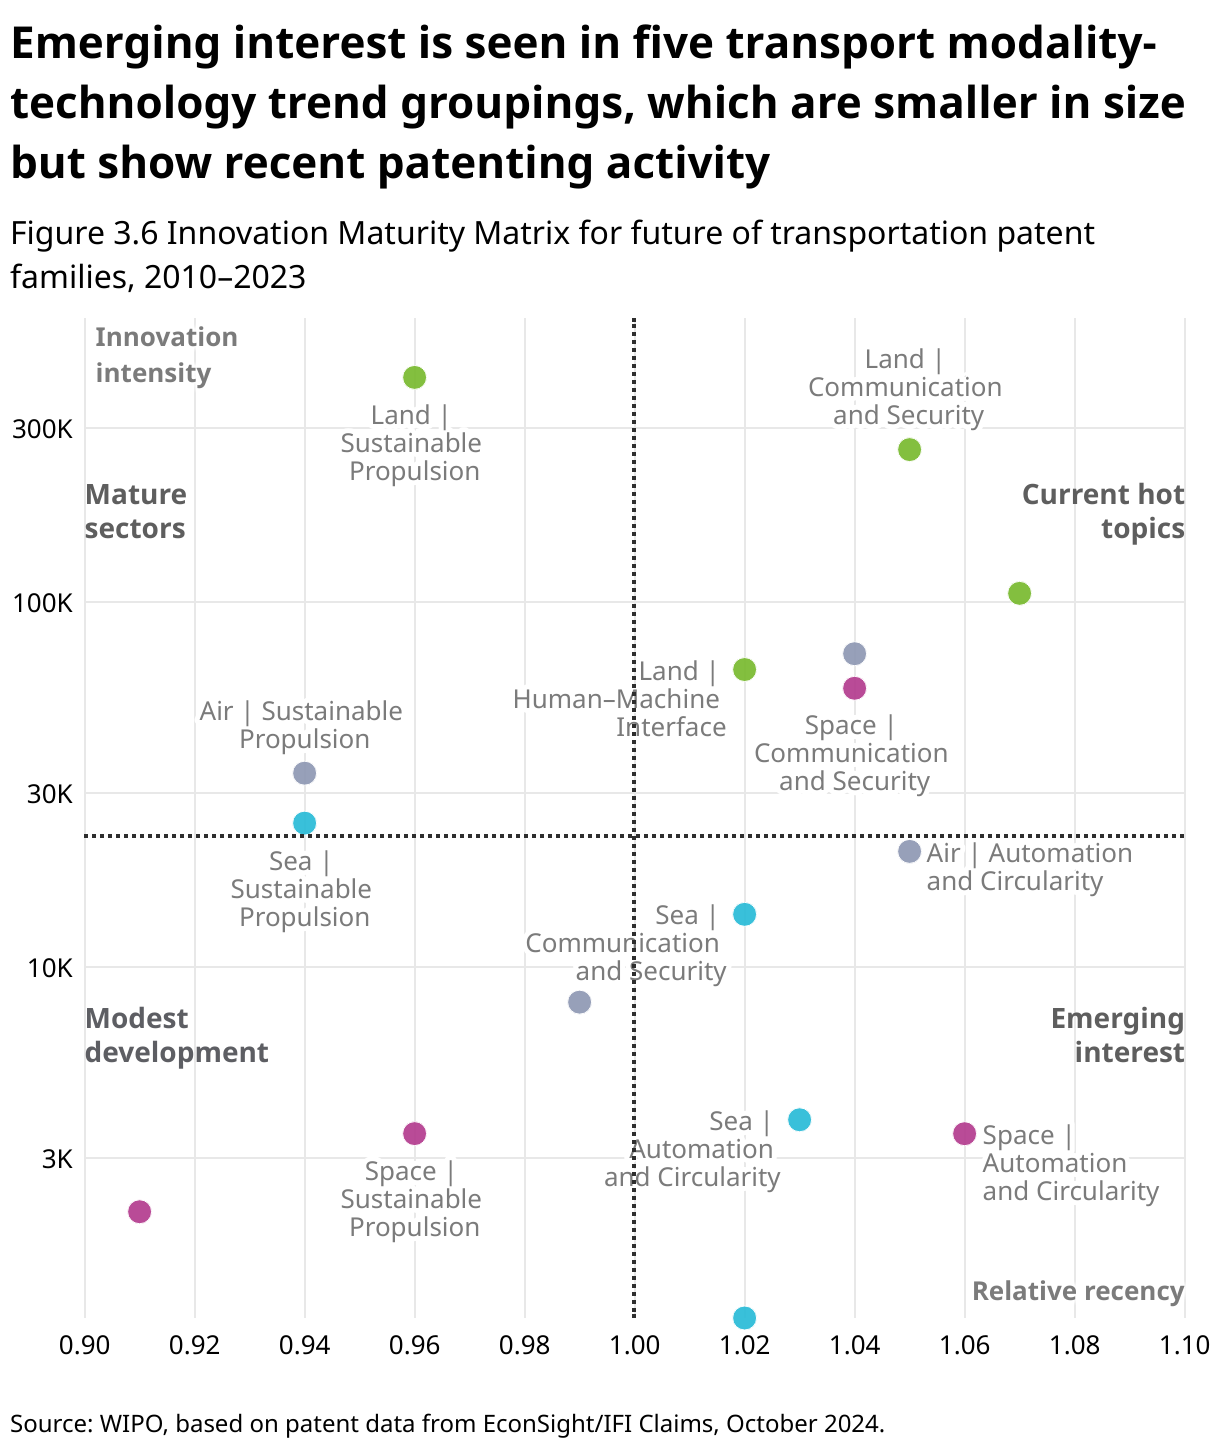
The relative technological maturity of each technology trend in each transport modality, as seen from a patent perspective, can also be assessed using an Innovation Maturity Matrix. This categorizes all future of transportation patent families according to their respective transport modality-technology trend grouping alongside their respective recency, that is, a measure of how recently the future of transportation patent applications in question were filed.
Figure 3.6 shows the Innovation Maturity Matrix for future of transportation patents filed since 2010. It offers a slightly different perspective on the 16 transport modality- technology trend groupings than that shown with the WIPO Patent Momentum Indicator in Figure 3.5. Five of these groupings (including Communication and Security technologies for Land, Air and Space transport) have been identified as current hot topics, meaning they all have a large number of patents and have recorded strong growth in recent years. There are also five transport modality- technology trend groupings (including Automation and Circularity technologies for Sea, Air and Space transport) where the number of patent families is smaller but an emerging interest can be seen in the recent growth in patenting activity related to these technology areas. Whereas this is difficult to detect in Figure 3.3 and Figure 3.4, it is more clearly visible in the Innovation Maturity Matrix. In contrast, the relative recency of Sustainable Propulsion technologies in all four transport modalities is low, suggesting a recent slow-down in the development of new inventions for Sustainable Propulsion technologies, with the maturing of such technologies for Land, Sea and Air transport.
Visualizing technology trajectories
Patent analysis in broad technology sectors, such as transportation, can be challenging due to several complexities inherent in patent data and the technologies themselves. Broad sectors often encompass diverse and overlapping technology areas and sub-areas, making it difficult to define clear boundaries for analysis. Rapidly evolving technologies, such as urban air taxis and micromobility add another layer of complexity, as emerging fields lack historical data and established classification schemes. In some technology sectors, patents may precede market trends by years, creating a temporal disconnect between technological activity and commercial outcome. Yet while this presents an interpretation challenge it is also a strategic opportunity.
These broad technology sectors can be termed "metalandscapes" because their analysis requires undertaking the patent landscaping of multiple patent landscapes. Analyzing technology metalandscapes using advanced patent analytics to assess trajectories and fragmentation is a new area of research. Adel and Harrison propose the use of Discrete Pareto Analysis (DPA) to analyze patent landscapes, in order to gain graphical insights into technology proliferation and consolidation dynamics across various domains.
Using this approach, the metalandscapes for Land, Sea, Air and Space, are displayed in Figure 3.7, which shows the industry trajectories for each modality in the future of transportation since 2010. The fragmentation index depicts the degree of fragmentation (i.e. influx of new players), as opposed to consolidation (i.e. dominance by top patent owners). Fragmentation may be interpreted as an indicator of innovation since the entry of new players encourages competition and inventive diversity. In such environments, smaller companies and new entrants must differentiate themselves, often leading to novel ideas and unique approaches to problem-solving. A lack of market dominance by a few large firms ensures that innovation is not stifled by entrenched interests seeking to protect their existing technologies or market position. Furthermore, fragmented industries provide greater opportunity for collaboration and the cross-pollination of ideas, as diverse players experiment and share insights, creating a dynamic ecosystem that drives technological progress and economic growth.
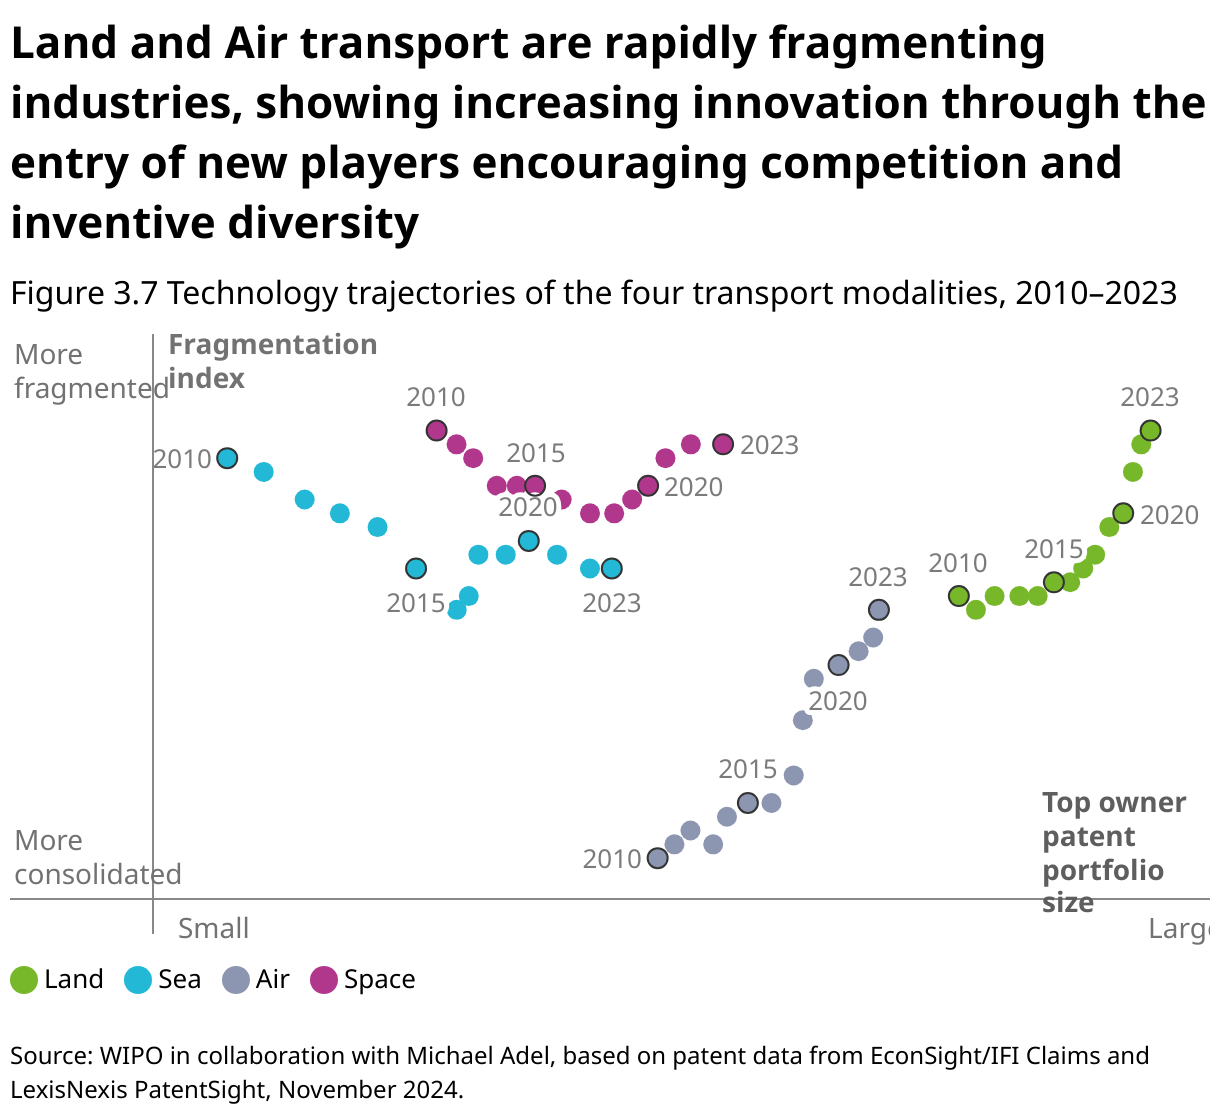
The trajectories for the four transport modalities shown in Figure 3.7 are interpreted as indicators of market dynamics, providing a better understanding of innovation and the competitive landscape within the transportation sector. The data shows that Air transport is the most consolidated (least fragmented) modality, dominated by a smaller number of larger players, such as Airbus, Boeing, Safran and RTX (formerly Raytheon). The trajectory for Air transport shows increasing fragmentation over the past decade which appears to be, in part, due to the growth of the drone industry in recent years.
As we have already seen, Land transport is the largest of the four modalities studied, and its trajectory shows a rapid fragmentation since 2017, most likely due to the growth and emergence of the EV market. Space transport is the most fragmented modality over the time period studied, possibly driven by the lower costs of building, launching and operating space technologies compared to the preceding decades, enabling more startups and smaller companies to participate.
Sea transport, on the other hand, show the trajectory of a more traditional industry with gradual growth over time and decreasing fragmentation in the metalandscape, but with a small uptick in recent years. This suggests an increasing dominance by the main industry players, with less new entrants entering the market, but that we may have reached an inflexion point. It will be interesting to see if, in the future, the recent upward trajectory continues in a similar to manner to that seen in Land and Air transport. This could be due to a possible lagging response within the maritime sector to innovations related to the future of transport, namely the Sustainability and Digitalization megatrends and the four related technology trends discussed in this report.
Top inventor locations
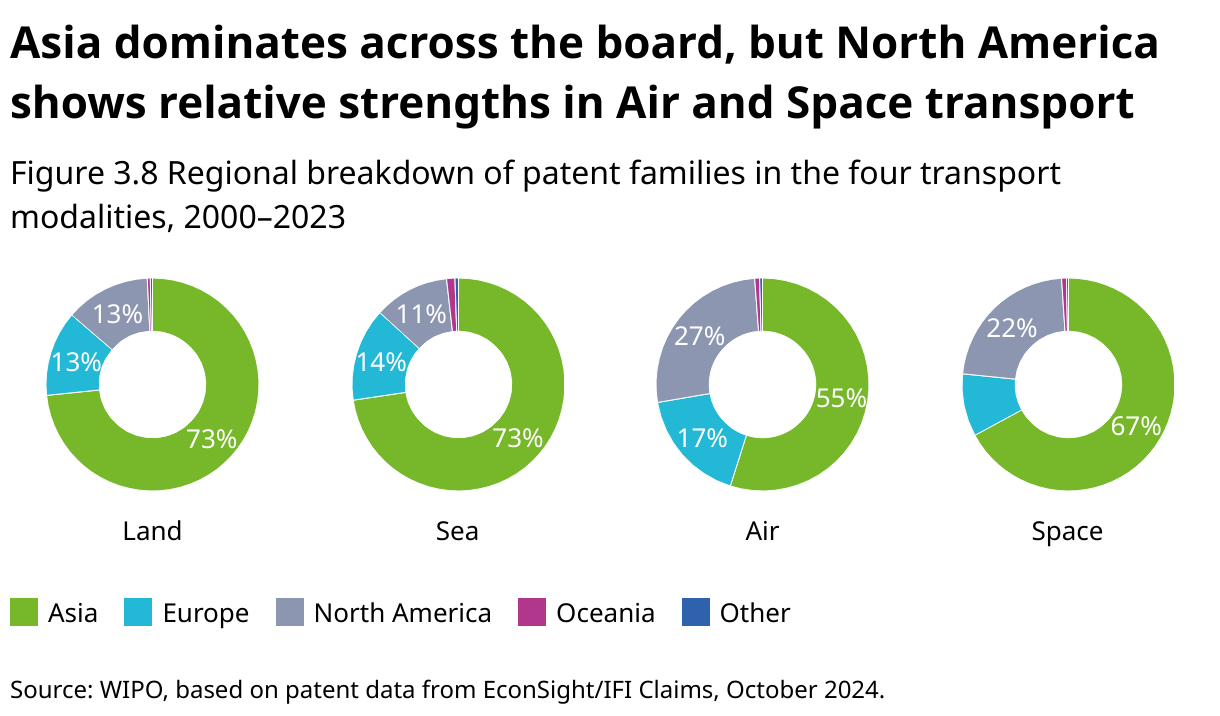
At the regional level, there is a strong dominance of patenting from Asia across all four principal transport modalities, especially in Land and Sea transport (Figure 3.8). North America has relative strengths in Air and Space transport, but there is very little patenting activity relating to future transport technologies in Africa, Latin America or Oceania.
At the country level, five locations – China, Japan, the United States, the Republic of Korea and Germany – have accounted for the majority of patenting activity in future transport technologies (Figure 3.9). Collectively, these five locations generated almost 1,050,000 patent families in future transport technologies between 2000 and 2023, representing over 90% of all patent families in these technologies.
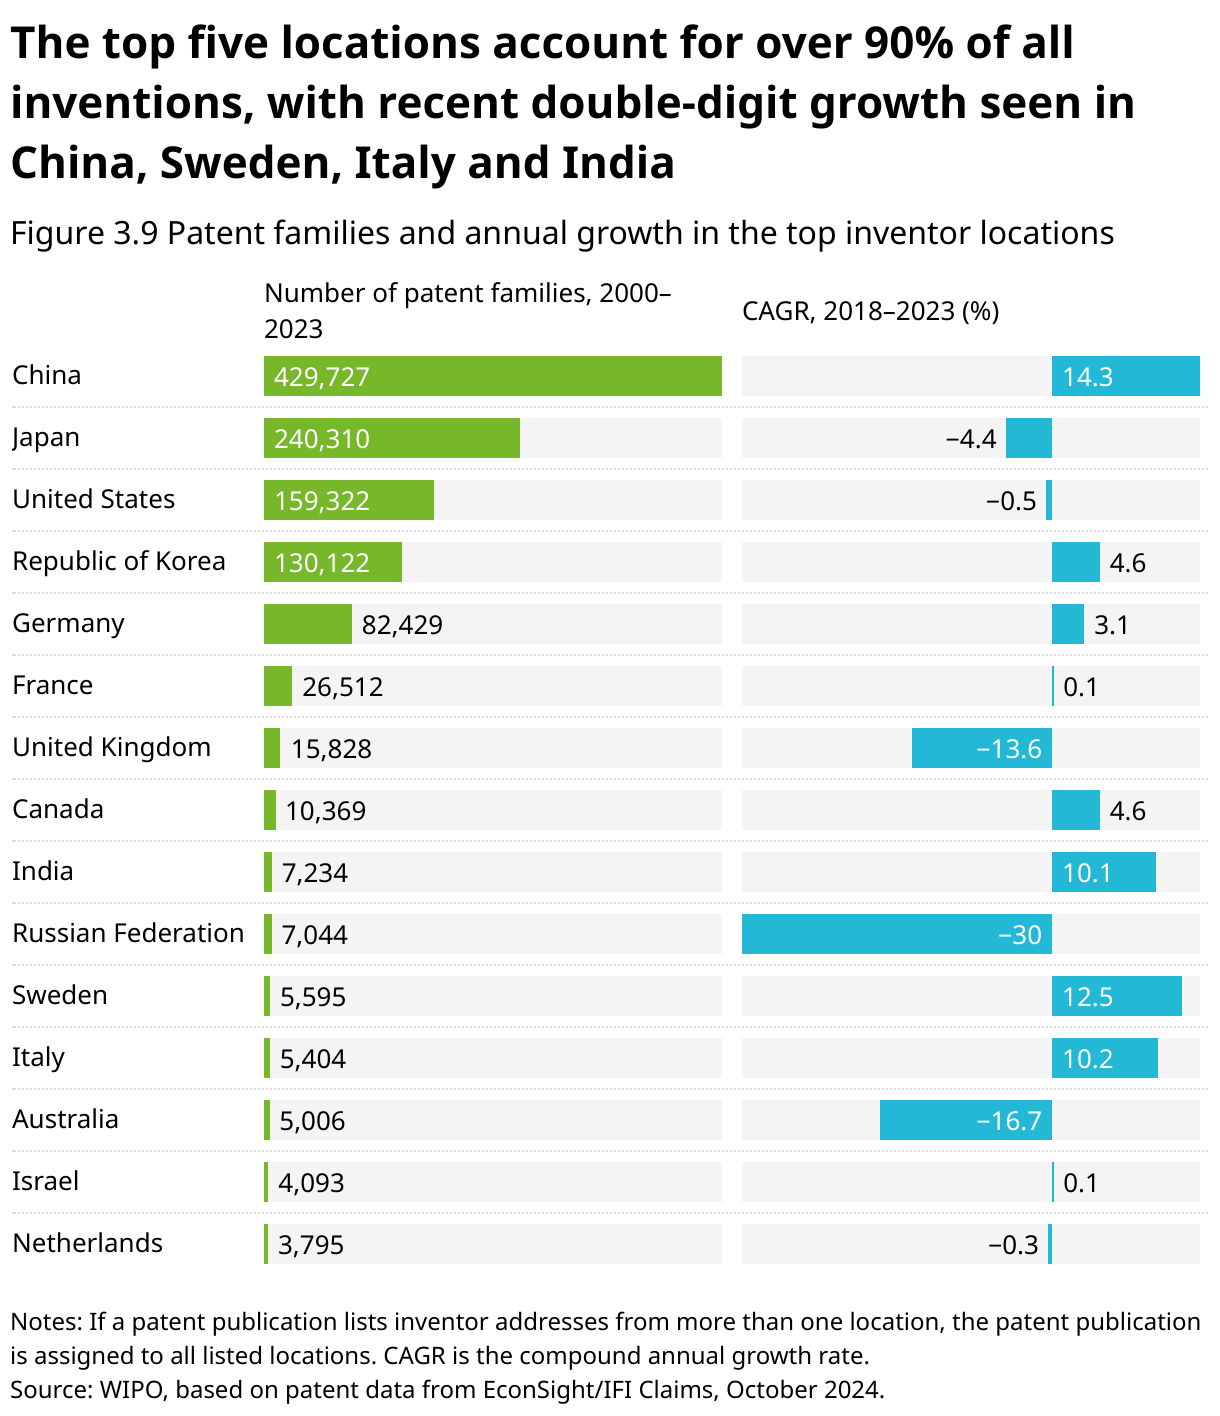
However, when we examine the overall increase in patenting activity in recent years, a different picture emerges. Since 2018, China has been the primary driver of global patenting activity in future transport technologies, with a growth rate of 14.3%. The number of annual patent families from China almost doubled, from 38,900 in 2018 to almost 76,000 in 2023. Among the other top 15 inventor locations, only India, Italy and Sweden have also achieved a double-digit patent growth rate, but they still lag behind China.
The growth in other major research locations, including the Republic of Korea and Germany, has been significantly lower than that observed in China. It is also worth noting that there has been a negative growth rate in patent families from Japan and the United States between 2018 and 2023, as well as in Australia, the Netherlands, the Russian Federation and the United Kingdom.
Closer analysis reveals large volumes of patenting from China across all four transport modalities and, despite the large absolute numbers, China has demonstrated recent growth across all four transport modalities (Figure 3.10). The United States has a significant global market share in the development of future Air and Space transport. However, the largest total number of patents from the United States between 2018 and 2023 has been in Land transport. Japan's research activities are heavily focused on Land transport technologies.
Germany has strengths in Land transport and has increased its patent families in this area in recent years, although their patent growth was highest in Space transport technologies. The Republic of Korea is one of the global leaders in the development of future Sea transport technologies, although Land transport is their most significant field in terms of absolute patent numbers.
Looking in Figure 3.10 at patenting activity in the four technology trends instead of according to transport modalities, China again leads in all four technology trends in terms of number of patent families and patent growth. The United States has technological strengths in HMI and Communication and Security technologies. Japan has a large number of patent families in HMI and Sustainable Propulsion technologies, but patent family growth was negative in both of these technology trends between 2018 and 2023.
Germany has strong growth in Sustainable Propulsion technologies since 2018, but limited recent growth in the other three technology trends. The Republic of Korea has achieved dynamic growth rates in Sustainable Propulsion and Automation and Circularity technologies, but has seen a negative growth rate in HMI technologies in recent years.
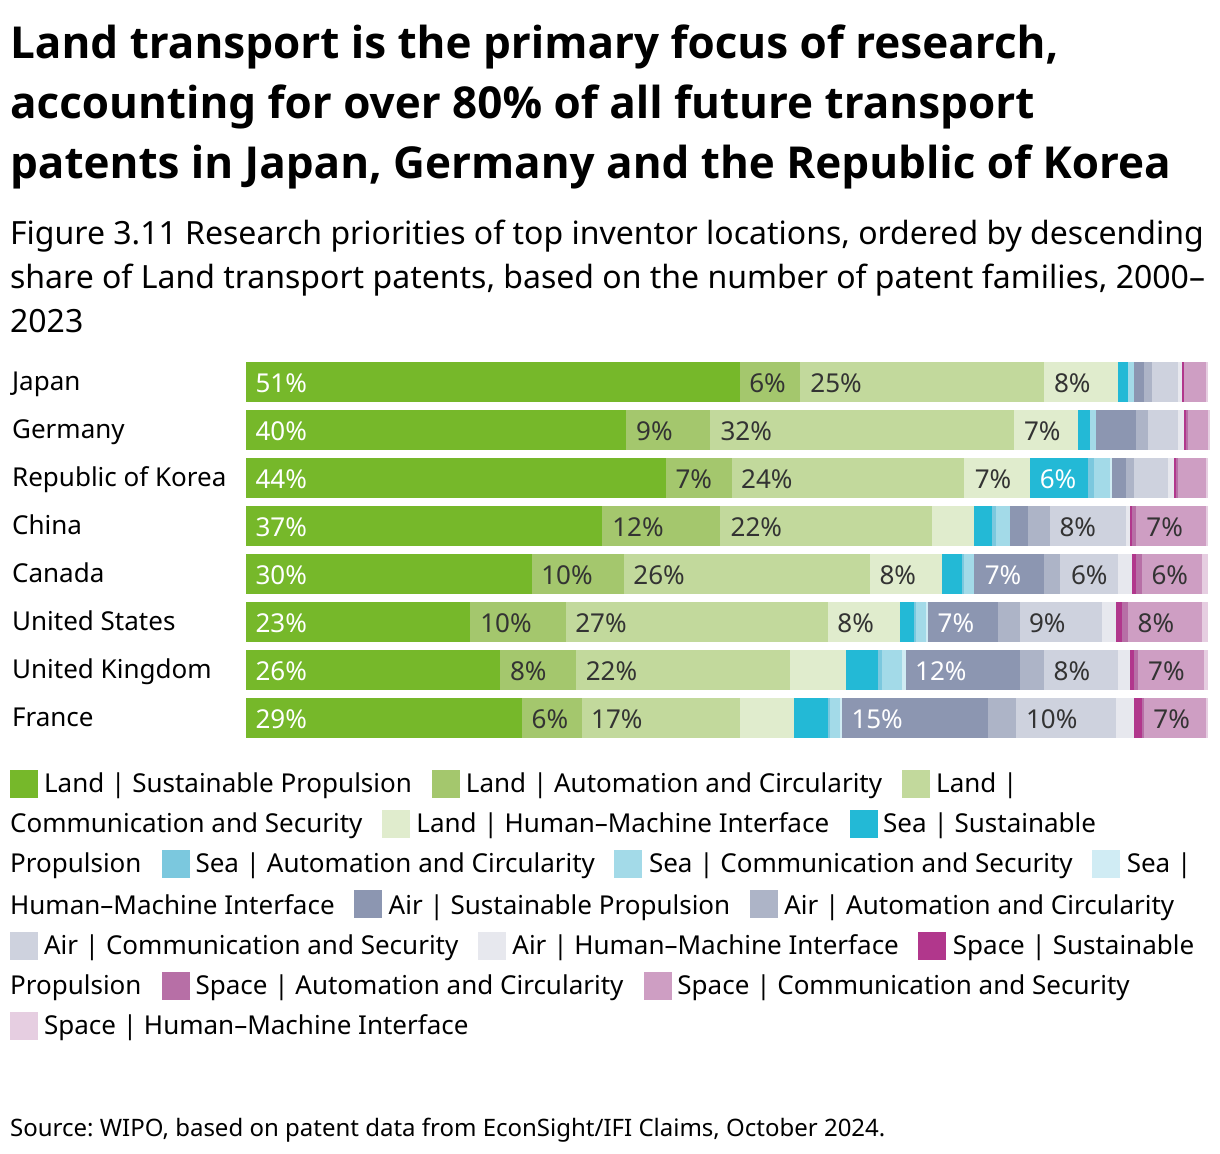
An alternative view of the proportional research priorities of the top inventor locations, based on the number of published patent families in each of the 16 transport modality-technology trend groupings, is shown in Figure 3.11.
The Relative Specialization Index (RSI)
In other words, RSI has the advantage of providing a comparison of two locations’ patenting activity in a technology relative to those locations’ overall patenting activity. The effect of this is to highlight locations that have a greater specialism in the technology area studied than would be expected from their overall level of patenting, and which might otherwise appear further down in the top inventor location lists, often unnoticed.
Figure 3.12 provides a detailed view of the Relative Specialization Index in future transport patents across various inventor locations, each demonstrating unique strengths and focuses.
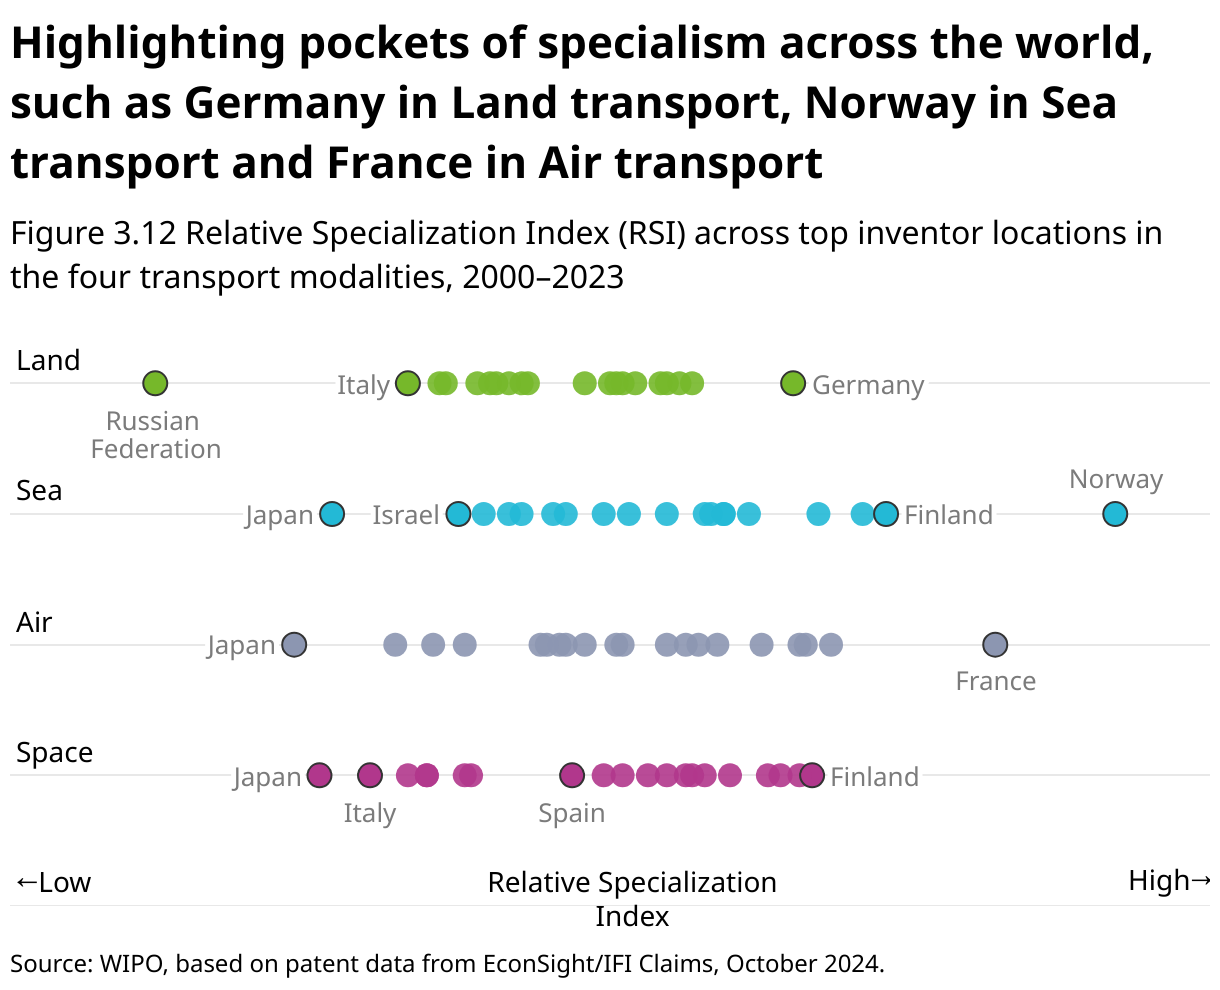
For Land transportation, Germany and Sweden demonstrate the highest levels of specialization, reflecting a strong emphasis on innovation in this domain. These findings align with their advanced automotive and rail industries, which are globally renowned.
In Sea transportation, Norway and Finland emerge as the most specialized inventor locations. This focus is likely rooted in a maritime heritage and reliance on shipping and related industries. Norway's high specialization underscores its significant role in maritime technology, while Finland’s innovative efforts in this area are similarly notable.
Air transportation is led by France and the United States, which exhibit the highest RSI values in this modality. This is indicative of a robust aerospace industry and longstanding leadership in aviation innovation. These two countries are also very strong in Space transport, although Finland also stands out here, but its absolute number of patents is small compared to those of France and the United States.
Overall, the findings reveal clear national priorities and capabilities. Inventor locations such as France, Germany, Norway, Sweden and the United States lead in their respective areas of transportation innovation, supported by strong industrial ecosystems. Meanwhile, Finland’s leadership in both Sea and Space transportation highlights its ability to excel in specialized niches. In contrast, Japan’s broader but less focused approach to transportation technologies may indicate a strategy of diversification rather than deep specialization in any one modality.
Top patent owners
At the company level, Japanese, German and US automobile manufacturers and suppliers are the top patent holders over the entire period analyzed, from 2000 to 2023 (Figure 3.13). Toyota Motor published by far the most patents in future transport technologies, with almost 55,000 patent families. US aerospace and defense conglomerate RTX Corp is the only company in the top 15 whose main research focus is on a non-automotive transport modality, namely Air transport.
A different picture emerges when looking at the top universities and other research institutes in future transport technologies. China is home to the top 14 research institutes. With more than 6,800 patent families published since 2000, the Chinese Academy of Sciences is clearly in the lead.
Focusing on the increase in annual patent families over the period 2018 to 2023, Chinese companies take the lead, with CATL in first place (Figure 3.14). Again, the list is dominated by automotive manufacturers and suppliers. But there are also companies from other industries in the mix, such as Chinese Utility State Grid Corp of China, Chinese telecommunications company Huawei and Chinese technology company Tencent Holdings.
The top companies shown in Figure 3.13 have a long-standing and well-established position within the transportation industry so, although there are no Chinese companies among the top companies shown in Figure 3.13, the recent increase in filings by Chinese companies shown in Figure 3.14 shows a recent growth in patent portfolio size. It inherently takes time to establish a well-rooted patent portfolio and, with the recent growth shown in Figure 3.14, only time will tell whether any of these companies rises up the rankings and into the list of top companies in Figure 3.13.
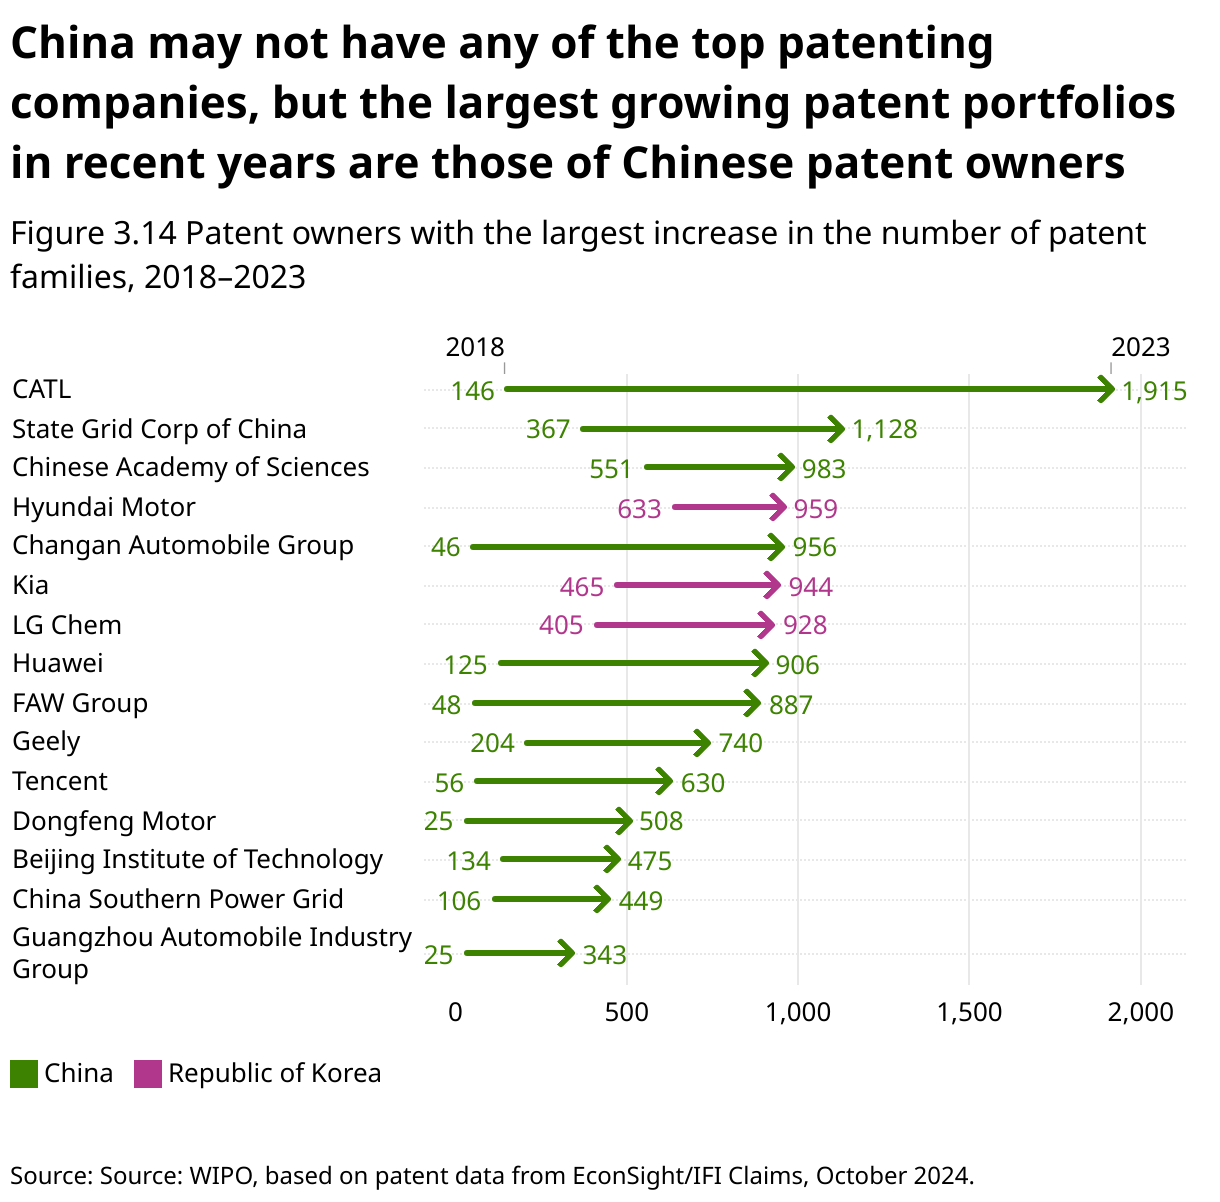
Figure 3.15 looks at the top research players in the four transport modalities across the four technology trends from the perspective of both patent portfolio size and compound annual growth rate (CAGR).
Toyota Motor, Bosch, Denso, Honda Motor are the top research actors in future Land transport technologies. Toyota stands out in the Sustainable Propulsion technology trend, in which the Japanese carmaker claims a very high share of almost 9% of all patent families worldwide since 2010. However, the patent growth of the top Japanese companies has been rather slow and even negative in some areas, whereas German companies, such as Bosch, have managed to increase their patent portfolios at a dynamic pace.
China's Harbin Engineering University is the top patent owner in the field of future Sea transport technologies and has grown its patent portfolio very dynamically since 2010. The university has a particularly high global share in Automation and Circularity technologies. Other top research players in future Sea transport technologies are Mitsubishi Heavy Industries, Gaztransport et Technigaz, Wuhan University of Technology and Dalian Maritime University. These four research players have a focus on Sustainable Propulsion and Communication and Security technologies.
The field of future Air transport research is dominated by the United States and European companies. RTX Corp tops the list with a clear focus on Sustainable Propulsion technologies (13% global share). RTX Corp has also shown very high growth rates in all four technology trends in the past. The rest of the top research companies include the aircraft duopoly Airbus and Boeing and the aerospace engine makers Safran and General Electric (GE). However, the patent growth for these companies has been moderate since 2010.
The Chinese Academy of Sciences, the China Aerospace Science and Technology Corporation and the China Electronics Technology Group have published the most patent families in future Space technologies since 2010. The patent growth of these Chinese research players was also exceptionally high. Two other major research players are Boeing in the United States and Mitsubishi Electric in Japan. However, patent families by these two companies declined between 2010 and 2023.
Foreign-oriented patenting activity
Due to the vast size of the overall transportation sector, the following section of this report focus on foreign-oriented patent families – also referred to as international patent families (IPFs) or extended patent families – as opposed to domestic-only ones.
International patent families (IPFs) are a reliable and neutral proxy for inventive activity because they represent those inventions that applicants consider important enough to seek international protection for them. This serves to highlight innovations with a universal application, control for the difference in the propensity to file multiple patent applications for a single invention between patent offices and exclude singletons of possible low value while including high-value domestic inventions.
Analysis of international patent families (IPFs) from 2014 to 2023 provides insights into innovation across the four principal transport modalities of Land, Sea, Air, and Space (Figure 3.16). Each domain exhibits unique characteristics in terms of the number of IPFs, inventor locations and key patent owners, reflecting technological advancements and competitive dynamics.
The Land domain leads with almost 225,000 IPFs, which highlights the global importance of innovation in road and rail transport technologies. For Land transportation, Japan leads with 29% of IPFs, followed by the United States (23%), the Republic of Korea (16%), China (15%), and Germany (13%), reflecting strong innovation in these locations. In terms of international focus, Sweden stands out, with 93% of its Land transport patents being IPFs, followed by the United Kingdom (81%), Canada (75%), and France and India (both 71%), indicating a strong emphasis on global protection compared to the global IPF average of 34% in Land transport. Leading companies such as Toyota, Hyundai Motor and Ford Motor are at the forefront, emphasizing the focus on sustainable and advanced vehicle technologies.
In the Sea domain, there are over 7,500 IPFs. In Sea transportation, the United States dominates in the number of IPFs, with 19% of IPFs, while Japan (17%), the Repubic of Korea (13%), China (11%), and France (10%) follow. Norway leads in international share, with 90% of its Sea patents being IPFs, trailed by Australia (85%), France (83%), the United Kingdom (78%) and Italy (73%), showing significant international activity. Patents from these locations far exceed the global IPF average of 22% in Sea transport. Key players include Gaztransport and Technigaz and Mitsubishi Heavy Industries, reflecting an emphasis on maritime technologies like shipbuilding and ocean exploration.
The Air domain is marked by almost 36,000 IPFs. Again, the United States takes the largest share, with 42% of IPFs, while China (14%), France (11%), Japan (11%) and Germany (9%) are also major contributors. Australia has the highest international share at 87%, followed by the United Kingdom (83%), Canada (81%), India (77%) and France (74%), which can be compared to the global IPF average of 35% in Air transport. RTX and General Electric lead the sector, indicative of intense research and development (R&D) in areas like propulsion systems and avionics. The concentration of IPFs among top firms points to the significant capital and expertise required to innovate in aerospace and the strategic importance of maintaining technological leadership.
For Space transport, with its almost 14,000 IPFs, the United States leads with a 37% global share, followed by China (24%), Japan (13%), Germany and the Republic of Korea (both 7%). Sweden stands out with 96% of its Space patents being IPFs, while the United Kingdom (85%), France (84%), Germany (81%) and Canada (76%) also prioritize global patent protection within this sector, compared to the global IPF average of 25% in Space transport. Huawei and Lenovo are key players, reflecting the growing intersection of telecommunications and aerospace technologies.
Based on the total future transport IPFs counts for each inventor location from 2014 to 2023, the United States holds the highest count with 73,864 IPFs, followed by Japan (71,073). China comes in third with 42,944 IPFs, while the Republic of Korea has 38,439 IPFs. Germany ranks fifth with 34,711 IPFs, followed by France (12,848), the United Kingdom (8,599), Canada (5,255), India (4,396) and Sweden (3,866) rounding off the top 10 inventor locations.
Overall, the IPF analysis highlights how each of the four principal transport modalities reflects different innovation dynamics and industry focus. The Land domain's vast number of IPFs points to widespread global innovation, whereas the Air domain has the highest global share of IPFs, highlighting its strategic importance and the high stakes of aviation advancements. The Sea and Space domains, though smaller in terms of number of IPFs, reveal specialized and critical areas of technological development.
Patent litigation in transportation
The landscape of patent litigation varies significantly across the different modalities in the future transportation sector, with notable differences in volumes of litigation, litigation ratios, and inventor locations. Analysis of patent dispute data, shown in Figure 3.17, highlights key trends and patterns in patent litigation.
In the Land transport modality, patent litigation activity reveals a competitive landscape in road and rail technologies. China leads in terms of litigated patents, with 514 cases, closely followed by the United States with 466. Other inventor locations with significant volumes include Japan and Germany, and there is a strong automotive industry in all of these locations. Although China has a higher volume of litigated patents, the United States demonstrates a greater litigation ratio of 0.6%, compared to China’s 0.2%, reflecting a more active approach to legal enforcement. Australia has the highest litigation rate, with 1.6% of all Land transport patents in Australia resulting in dispute, far above the global average of 0.2%.
In Sea transport, China leads in litigated patents, with 35 cases, followed by the United States at 23, which reflects China’s expansive research and development efforts in maritime technology. Sea transport also has an average litigation rate of 0.2% globally, with the highest share of litigated patents in Sea transport seen in Finland (1.7%), Australia (1.2%) and the United States (0.9%).
In the Air transport modality, the litigation ratio is slightly higher at 0.3%, with Australia having a significant litigation ratio of 2.7%, which underscores a proactive stance on patent enforcement relative to its patents in Air transport. China holds the highest volume of litigated patents with 126 cases, followed closely by the United States at 125.
In Space transport, the litigation ratio is also 0.3%, comparable to that of the Air modality and indicating a similarly high level of patent disputes. The United States is a dominant contributor, with 133 litigated patents, followed by China with 37. Again, the United States and Australia both have a larger share of Space transport in dispute that the global average, and substantially higher litigation ratios than the global average are also seen in Canada and the United Kingdom.
Beyond patents – exploring transportation trademarks
Trademarks are crucial within the transportation sector because they establish brand recognition, build trust and differentiate between companies in a highly competitive market. In transportation, safety, reliability and efficiency are top priorities, and a recognizable trademark and a strong brand can signal quality and dependability to customers. For instance, when people see well-known logos from transportation brands such as Toyota, Uber or Lufthansa, they immediately associate them with a certain standard of service or product quality, which can influence their choices.
Trademarks also help protect a company’s reputation by preventing others from imitating their brand or misleading customers. In a field where companies invest heavily in developing technology and customer service standards, trademarks provide legal grounds to defend their brand identity. As transportation companies expand internationally, strong trademark protection can ensure that brand recognition and trustworthiness carry over to new markets, enhancing customer loyalty and brand equity on a global scale.
By looking beyond just patents and exploring global trademark data, we can see that from 2004 to 2023, trademark filings in Goods (vehicles and vehicle parts, class 12 in Nice classification) and Services (transportation services, class 39 in Nice classification
However, a notable shift has occurred in the more recent period from 2018 to 2023, when growth rates slowed considerably. Filings for Goods experienced a modest growth rate of 1.4%, whereas Services saw a slight decline, with a CAGR of –0.6%. This resulted in an overall modest growth rate of only 0.3% for Goods and Services combined. This apparent slowdown in trademark activity may be attributed to various factors, including the lingering impact of the COVID-19 pandemic and changes in business priorities influencing filing behavior across these classes.
The synchronized trends between Goods and Services suggest that both categories are similarly affected by broader market dynamics and economic conditions. External factors, such as economic cycles, industry shifts and consumer behavior, have likely contributed to the alignment of trends in trademark activity across these classes. The overall stability observed in trademark filings underscores the significant impact of prevailing economic conditions on brand protection efforts in the transportation sectors.
Geographically, China stands out as a dominant player in trademark filings for Goods, exhibiting a growth rate of almost 7.5%. Filings increased more than two-fold from 41,162 in 2014 to 85,438 in 2023, supported by China’s robust automotive industry and proactive trademark protection efforts. Despite a slight decline in filings after 2021, China's strong position in the market remains evident. Filings from the United States increased from 5,570 in 2014 to 11,751 in 2023, resulting in a very healthy CAGR of 8.9%. However, this growth has shown signs of slowing, with a CAGR of 7.4% from 2018 to 2023.
In the realm of Services, China again leads with a more than two-fold increase from 28,602 filings in 2014 to 70,411 in 2023 (CAGR of 10.1%). Other noteworthy contributors include the Islamic Republic of Iran, whose filings rose from 8,631 to 17,053 during the period, and Brazil, which has seen a CAGR of 10.9% and reaching 9,446 filings in 2023.
Overall, the analysis of trademark filings in Goods and Services from 2014 to 2023 reveals a dynamic landscape characterized by growth trends influenced by regional players and market shifts. While established markets like China, the United States, and the European Union (EU) maintained a strong position, emerging markets such as Brazil, the Islamic Republic of Iran, the Russian Federation and Türkiye are increasingly making their mark, contributing to a more competitive environment in trademark activity.
Prominent players within the automotive sector have also contributed to these filing trends (Figure 3.19). In transportation Goods, Asian giants Toyota, Kia and Hyundai lead the way, whereas trademarks in transportation Services are led by Beijing Jingdong Triple Bai Lu, American Airlines and Amazon.
More broadly among the top 25 trademark filers in transportation Goods and Services, there is an interesting difference between the two lists. In transportation Goods, the biggest trademark portfolios belong to large automotive manufacturers such as General Motors, BMW, Jaguar Land Rover and BYD, and suppliers, such as the tire companies Bridgestone and Goodyear, and parts companies like Shimano. In contrast, the biggest trademark portfolios in transportation Services include a broader range of industries within the transportation sector – the list includes airlines such as Saudi Arabian Airlines and United Airlines, e-commerce companies like Alibaba, logistic companies, such as UPS and DHL, and travel companies including Uber, TUI and Hertz, as well as technology companies like Apple and finance companies like American Express.
Beyond patents – industrial designs within the transportation sector
Industrial designs are also important within the transportation sector because they enhance both functionality and customer appeal, providing a competitive edge in a market where aesthetics, ergonomics and user experience are increasingly valued. An industrial design covers the visual aspects of a product – its shape, lines, patterns and overall look – elements that strongly influence consumer perception and satisfaction.
In the automotive industry, for example, a well-designed car is not just visually appealing; it often reflects brand identity, safety and innovation. Companies like Tesla and BMW use distinct designs to communicate values like performance, luxury or sustainability, helping them stand out in a crowded market.
Industrial designs also protect companies' investments by giving them exclusive rights to unique visual features, preventing competitors from copying their look and feel. This ensures that innovations in design contribute to brand identity and market differentiation, making industrial design a valuable asset within the transportation sector.
By analyzing industrial designs in transportation (Locarno class 12), which includes vehicle-related designs across Land, Sea, Air, Space and others.
Locations with dominant automotive industries lead the registrations, such as China, the United States, the Republic of Korea and Japan at the forefront. Japanese giant Honda is the top owner (3,857 registrations), followed by Hyundai (3,717) and Kia (2,881), both from the Republic of Korea, showcasing their strength in the global automotive market. Geely (2,575), a leading Chinese automotive manufacturer, and CITIC Dicastal (2,400), a leading Chinese manufacturer of automotive parts, are also significant players, reflecting the rapid growth of its domestic automotive industry.
Traditional Western companies like Ford and Jaguar Land Rover maintain prominence with over 2,100 combined registrations each. Strong recent growth is also seen from companies such as BYD (not shown in Figure 3.20) with 532 filings, who are becoming increasingly prominent players in global vehicle design, especially in electric vehicles.
Neighboring classes, particularly Class 21 (furniture and articles not classified elsewhere) and Class 8 (hand tools and implements), have seen parallel growth. The relationship between these classes and industrial designs in transportation is often driven by innovations in vehicle interiors and ergonomics, influenced by furniture design principles.
Beyond patents – insights into market, regulatory, and economic landscapes
Several critical dimensions that extend beyond the realm of intellectual property have also been explored. While patents offer valuable insights into technological innovation, understanding the broader market, regulatory frameworks, and economic conditions is essential for a comprehensive analysis.
The global transportation industry market (Figure 3.21) reached USD 7.3 trillion in 2022 and is projected to grow to USD 11.1 trillion by 2030, with an expected CAGR of 5.4% from 2023 to 2030.

Standards are critically important. And before you start delving into technical standards, you need to be looking at the safety and quality standards that already exist.
We must have more companies engaged in the development of standards. It is to their benefit and it is to the industry's benefit. And we will get to where they want to get to faster as a result.
Land transportation has emerged as the highest-growing segment, covering over 42.3% of the market in 2022. Key players include DHL, BlueDart and C.H. Robinson Worldwide. The COVID-19 pandemic caused a substantial disruption to transportation services and global supply chains, while recent geopolitical conflicts have complicated trade dynamics and maritime logistics. Recent developments highlight strategic alliances and technology integrations, such as the partnership between Flexport and Nolan Transportation Group and MercuryGate International's smart transportation capabilities.
The smart transportation market is poised for significant growth, with its size estimated at USD 33.4 billion in 2024 and expected to reach USD 46.4 billion by 2029, growing at a CAGR of 6.8% during the forecast period.
The COVID-19 pandemic has accelerated the adoption of contactless and sensor- based technologies in public transit. Major players such as Cisco, SAP SE, IBM and Siemens are focusing on expanding operations and developing innovative solutions. Recent developments include projects and collaborations aimed at enhancing smart transportation infrastructure and integrating advanced technologies.

The future of transportation is poised for significant transformation, driven by the need for more sustainable, efficient and accessible mobility solutions. As in other fields, disruptive technologies hold promise to be game-changers but their widespread adoption is often challenging. Besides the technical hurdles in reaching full maturity, these technologies can have high initial costs as well as require significant infrastructure investment and an evolution in regulatory frameworks.
At CERN, the European Laboratory for Particle Physics, we are not only at the forefront of fundamental research, but also the development of the cutting-edge technologies needed to realize our scientific ambitions. Further, we are eager for our technologies to be at the heart of impactful societal innovations. The most well-known example of a CERN technology that has revolutionized our lives is probably the World Wide Web, but we are making significant contributions to other areas, including medical imaging, cancer treatment, cultural heritage, space missions, environmental applications, as well as the future of transportation.
When the conditions are right, exciting developments can happen. An example is CERN’s collaboration with Airbus UpNext, a subsidiary of Airbus, to explore the use of superconducting technologies in future hydrogen-powered aircraft. With SuperNode, a developer of energy transmission technology based on superconductivity, we are developing a novel type of insulation for superconducting cables with the aim of improving energy infrastructures and accelerating the transition to renewable energy. Artificial intelligence and machine learning can also be critical enabling technologies, and we have worked with Zenseact, a car-safety software company founded by Volvo Cars, on enhancing the speed and accuracy of decision-making in self-driving cars through improved deep-learning algorithms.
We are regularly confronted with the challenges of bringing disruptive technologies from a physics laboratory onto the market, especially when we deal with deep tech and “extreme” settings – superconductivity, superfluidity, cryogenic temperatures. We extend the lessons learned from the highly collaborative nature of particle physics research to our innovation partnerships and intellectual property policy: for example, we might choose a patent strategy or an open dissemination policy, depending on which choice maximizes the value of our technology for industry. The adoption by industry of technologies released under the CERN Open Hardware Licence is a great demonstration that there is no one-size-fits-all approach.The future of transportation will also be shaped by pioneering partnerships between research institutes and industry, and we should strive to catalyze more of these ventures: together, public research and the private sector can drive innovation more effectively than on their own.
The future of transportation is poised for significant transformation, driven by the need for more sustainable, efficient and accessible mobility solutions. As in other fields, disruptive technologies hold promise to be game-changers. But their widespread adoption is often challenging. Besides the technical hurdles in reaching full maturity, these technologies can have high initial costs and require significant infrastructure investment and an evolution in regulatory frameworks.
Governments worldwide actively promote sustainable transportation through a range of policies and programs. Such initiatives aim to reduce emissions, enhance mobility and improve infrastructure. Many places offer fiscal incentives for EV adoption, including purchase subsidies and tax rebates, as seen in China, Norway and the United States.
The regulatory landscape is intrinsically linked to the transportation sector and can have a big impact on innovation in transportation technologies. Regulatory Impact Analysis (RIA) by the Organisation for Economic Cooperation and Development (OECD) assesses the costs, benefits, and potential impacts of regulatory changes, essential for shaping transport policies.
The future of the transportation sector is defined by strategic policies addressing increasing global transport demand and CO2 emissions. The ITF Transport Outlook predicts, under the Current Ambition scenario, a 79% increase in passenger demand and a doubling of freight demand by 2050, while the High Ambition scenario forecasts a 65% rise in passenger demand and a 59% increase in freight demand.
This data-rich report on the future of transportation forms part of the WIPO Technology Trends series, combines IP analysis, scientific literature, policy impacts and expert insights to guide business leaders, researchers, and policymakers in making informed decisions.
But WIPO's support goes beyond providing reports. We empower local researchers, innovators, universities and research institutions in unlocking the full potential of intellectual property (IP), maximizing its impact on their ventures. By collaborating with stakeholders such as these, we at WIPO build, nurture and strengthen local innovation ecosystems, expanding their reach through national, regional and international networks.
To leverage IP as a tool for growth and sustainable development, WIPO offers support from the first spark of an idea and onward through its journey to market. WIPO provides services and amplifier programs that include, among others, IP information, improved access to the patent system, support for more effective IP rights management, facilitate more efficient technology transfer, and support for the use of IP as a financial asset. These services are underpinned by capacity building for individuals and institutions.
WIPO helps innovators leverage IP as a tool for growth and sustainable development. Our support for innovators includes:
Capacity building through programs directed at upskilling actors in the innovation ecosystem to effectively use the IP system, technological information and the knowledge to be found in patent and scientific and technical literature databases; and to manage IP from creation to the commercialization of products and services based on research outcomes.
(19)WIPO’s Technology and Innovation Support Center (TISC) program gives innovators in developing countries access to high quality technology information and related services to help them create, protect, and manage intellectual property rights. Our 1500 TISCs in 93 countries have handled over 7.5 million inquiries in the past four years. (20)WIPO's Inventor Assistance Program matches developing country inventors and small businesses with limited financial means with patent attorneys, who provide pro bono legal assistance to secure patent protection. (21)The WIPO Patent Drafting Training Program assists users of the patent system to develop practical skills in drafting and filing patent applications.
Resources, tools, and platforms that deliver insights, information and facilitate cost-effective interactions
(22)WIPO INSPIRE (https://inspire.wipo.int/) is a global knowledge center for innovation, helping innovators and entrepreneurs make informed decisions throughout the innovation cycle. It provides a unique blend of information and knowledge on patent search, patent analytics, technology transfer, and institutional IP policies, combining reference data with expert insights into resources, tools, and good practice recommendations. Networking opportunities that enable sharing of experiences and best practice
Thought leadership that facilitates global coordination in inclusive international technology transfer, IP analytics, and IP finance.
(23)WIPO. Intellectual property and technology transfer. Available at: www.wipo.int/web/technology-transfer. (24)WIPO. Patent analytics. Available at: www.wipo.int/en/web/patent-analytics/index. (25)WIPO. Intellectual property finance. Available at: www.wipo.int/web/ip-financing.